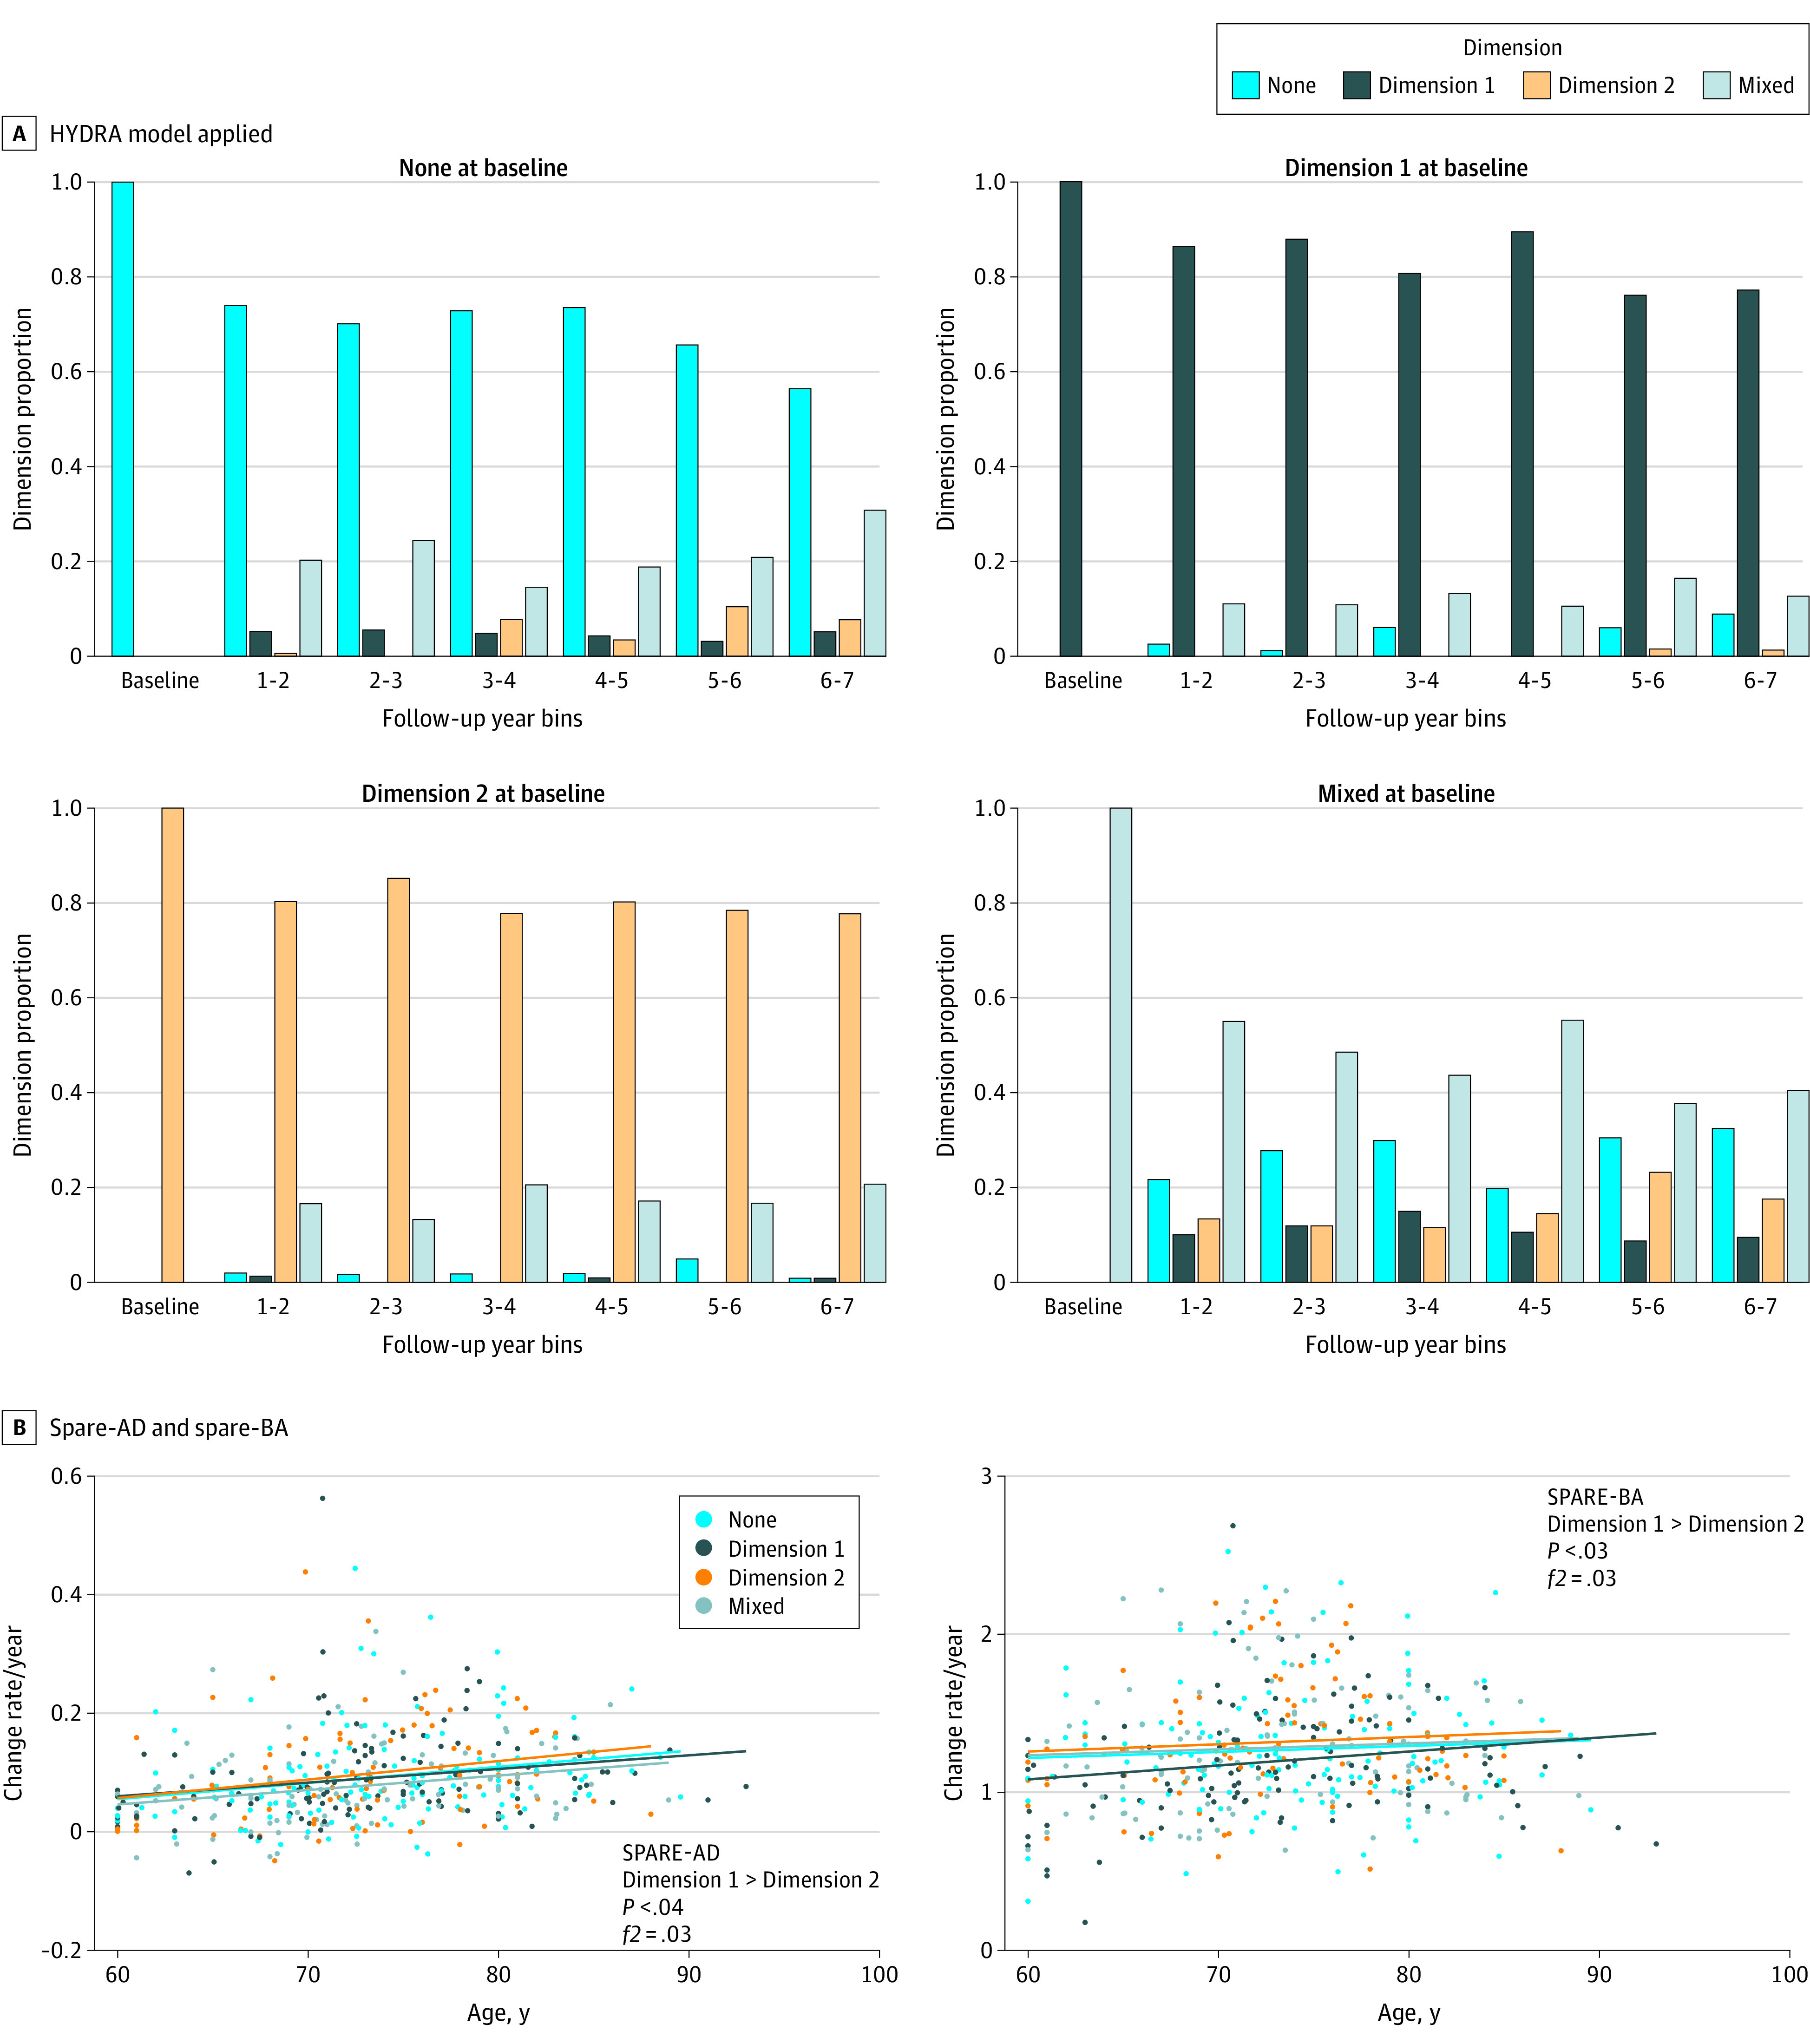
Figure 4. The 2 Dimensions and Longitudinal Trajectories to Aging and Alzheimer Disease.

A, Applying the heterogeneity through discriminative analysis (HYDRA) model to all available longitudinal scans with at least 6 years of follow-up. The 2 dimensions remained stable over time and were independent of each other. B, The positive rate of change for spatial patterns of atrophy for recognition of Alzheimer disease (SPARE-AD), and the spatial patterns of atrophy for recognition of brain atrophy (SPARE-BA) of dimension 2 was bigger than dimension 1, meaning that patients in dimension 2 were more vulnerable to Alzheimer disease and brain aging longitudinally. Only individuals that had at least 6 time points were included for this analysis.
