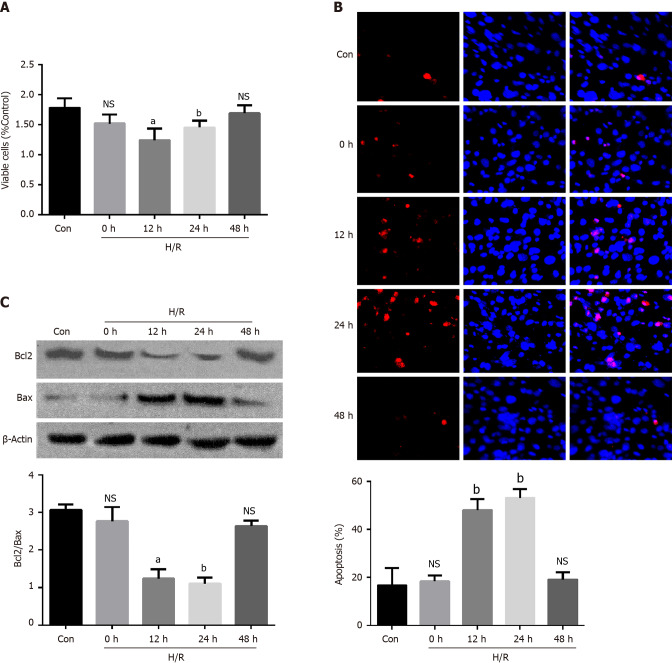
Figure 1.
Apoptosis was induced in Caco2 cells after hypoxia/reoxygenation treatment. A: Cell viability was tested using the CCK8 kit on different times after the hypoxia/reoxygenation (H/R) treatment, aP < 0.01 and bP < 0.001 vs control (n = 3); B: The quantification data of apoptosis tested by the TUNEL at different times after the H/R treatment, bP < 0.001 vs control (n = 3); C: Representative Western blotting and quantification data for cell apoptotic proteins Bcl-2 and Bax at different times after the H/R treatment. Data are presented as mean ± SD, aP < 0.01 and bP < 0.001 vs control (n = 3). NS: No significant difference; H/R: Hypoxia/reoxygenation.

