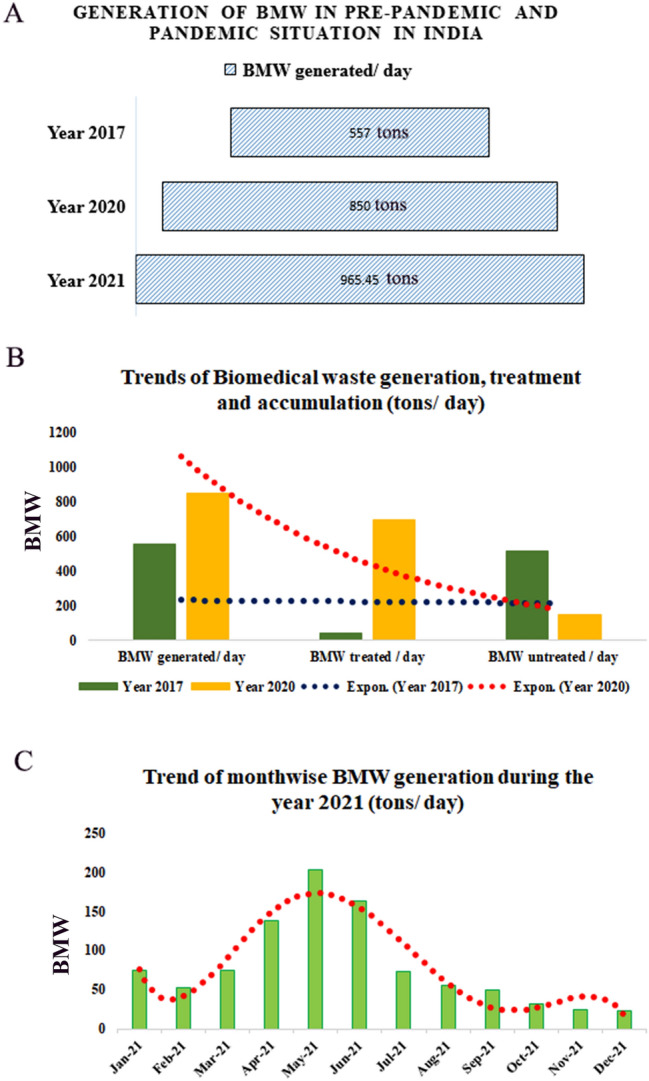
Fig. 1.

Graphical representation depicting biomedical waste (BMW) generation during pre-pandemic and pandemic situation in India, A. Pyramid histogram indicating significant increase in BMW production during pandemic condition, B. Graph represents BMW generation/day, BMW treated/ day, and BMW accumulated/ day during pandemics, C. Graphical representation of trend of month wise BMW generation during the year 2021 (data procured from CPCB, India https://cpcb.nic.in/)
