Figure 4.

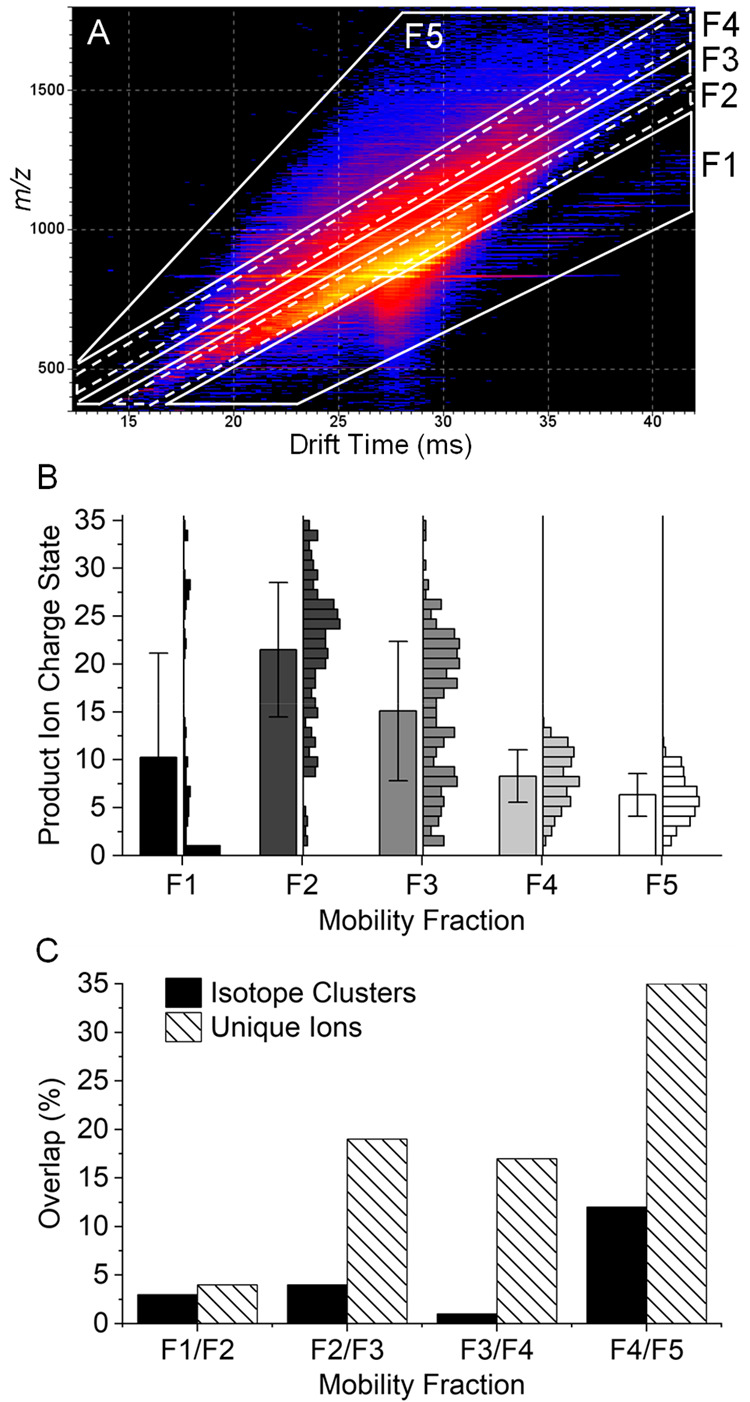
2D mobiligram (m/z vs drift time) for pre-cIMS ECD of the +35 charge state of bovine carbonic anhydrase II (A) with outlined mobility fractions. Product ions charge state distributions for each mobility fraction with 1 standard deviation error bars (B), and the percent overlap in unique isotope clusters and unique ions observed between adjacent mobility fractions (C).
