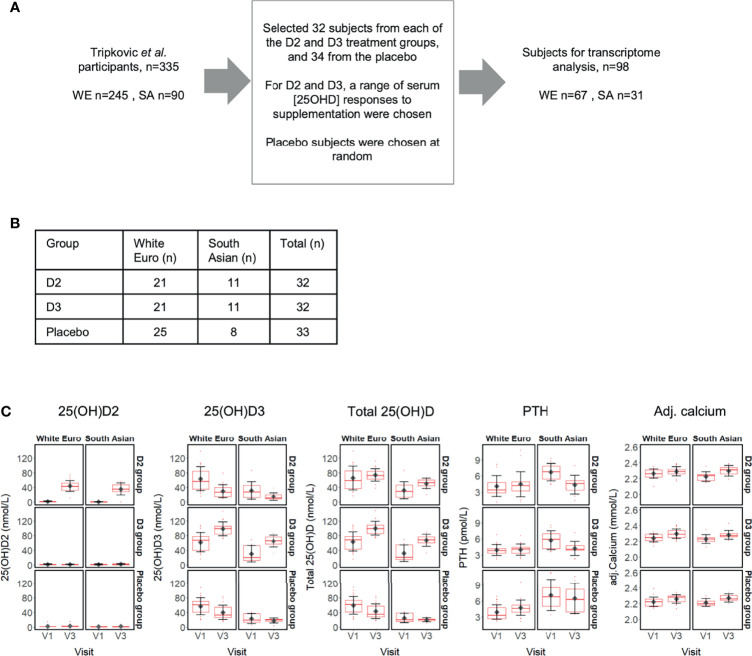
Figure 1.
(A) Selection of 98 subject participants from the Tripkovic et al. (2017) study (28) for transcriptomic analysis of their V1 (baseline) and V3 (12-week) samples in the present study; (B) Ethnicity and treatment group membership for the 97 subjects for which transcriptomic data was obtained (data for one South Asian subject from the placebo group did not pass quality control); (C) Metadata on serum concentrations of 25(OH)D2, 25(OH)D3, total 25(OH)D, PTH and calcium (albumin-adjusted) for the 97 subjects (see Supplementary Data File 1 for details). Participants were selected to provide comparable numbers between the placebo and the two vitamin D treatment groups, covering the full range of serum responses to supplementation within the D2 and D3 treatment groups, as judged from the measured changes in serum 25(OH)D2 or 25(OH)D3 concentrations between V1 and V3.

