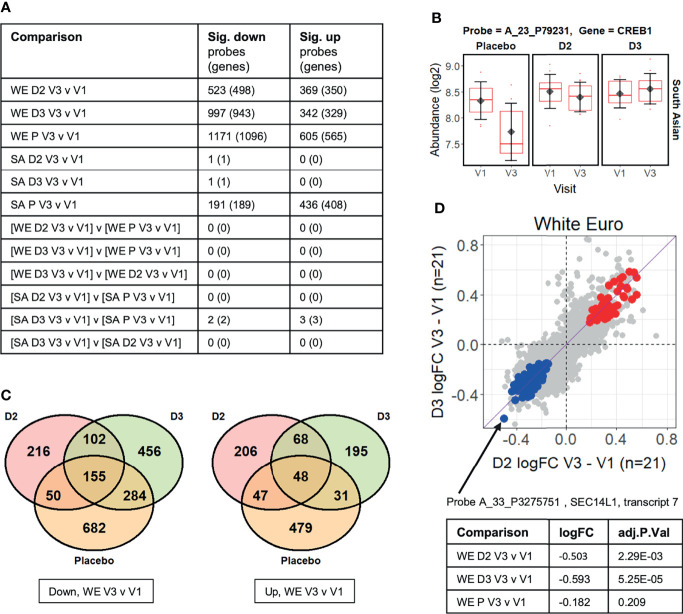
Figure 2.
(A) Summary of limma differential expression test results identifying significant changes (adj.P.Val ≤ 0.05) in transcript probe abundance within and between the experimental groups (see Supplementary Data File 2 for full details). Both the number of unique microarray probes, and the number of unique genome loci they represent, are indicated. WE = “white European”; SA = “South Asian”; D2 = vitamin D2 treatment group; D3 = vitamin D3 treatment group; P = placebo group. (B) The CREB1 gene probe signal is significantly different (adj.P.Val=0.021) between the vitamin D3-treated group and the placebo group over the course of the V1 to V3 study period in the South Asian cohort (i.e. [SA D3 V3 v V1] v [SA P V3 v V1] comparison from Figure 2A ). (C) Venn diagrams showing the numbers of probes in the white European (WE) cohort that are specifically significantly (adj.P.Val ≤ 0.05) down- or up-regulated in V3 compared to V1 in each treatment group. (D) Comparison of the log2 fold-changes (FC) in abundance occurring from V1 to V3 in the WE cohort in the D2 and D3 treatment groups. Probes significantly up-regulated in both D2 and D3 groups but not the placebo are coloured red, while those similarly down-regulated are shown in blue (see Supplementary Data File 3 ). A probe detecting SEC14L1 shows the largest decreases in abundance in those down-regulated by D2 and D3 but not placebo.

