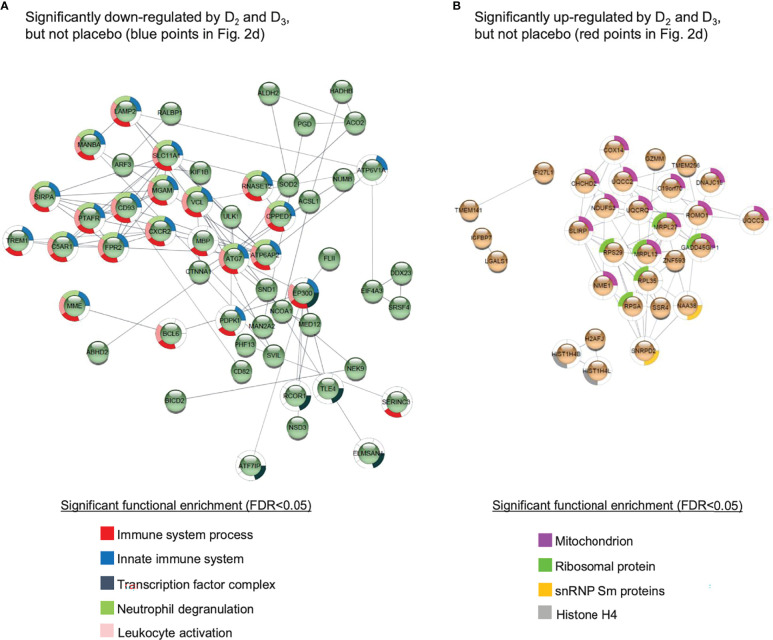
Figure 3.
Protein-protein interaction networks for gene products corresponding to the probes (A) significantly down-regulated or (B) significantly up-regulated in both the D2 and D3 treatment groups of the WE cohort, but not the placebo group. Details given in Supplementary Data File 3 . The networks were generated using the STRING database of Homo sapiens medium confidence (0.4) interactions, and only connected nodes are shown. Networks for both (A, B) are significantly enriched for interactions compared to randomised sets, yielding p-values of 1.98 × 10⁻⁶ and 4.99 ×10⁻⁹, respectively.

