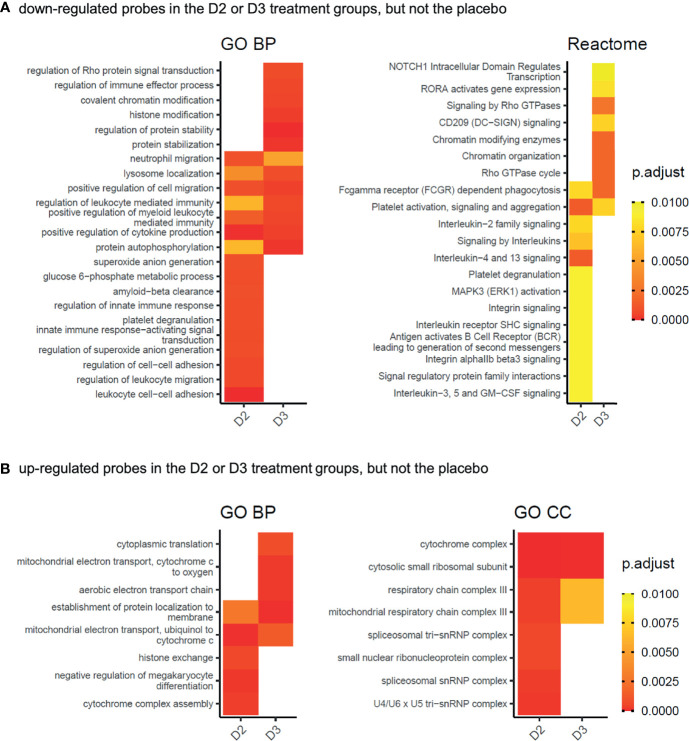
Figure 4.
Gene Ontology biological process (GO BP), cellular compartment (GO CC), or Reactome pathway functional categories significantly enriched in the gene products represented by the probes (A) significantly down-regulated (adj.P.Val ≤ 0.05) in the D2 or D3 treatment groups of the WE cohort, but not in the placebo group, and (B) significantly up-regulated (adj.P.Val ≤ 0.05) in the D2 or D3 treatment groups of the WE cohort, but not in the placebo group. Gene products represented by the significantly down-regulated probes in the comparisons WE D2 V3 v V1, WE D3 V3 v V1 and WE P V3 v V1 from Figure 2A , and possessing ENTREZ identifiers, were subjected separately to functional enrichment analysis using compareCluster (38). The details for each group are given in Supplementary Data File 4 . Significantly enriched categories (p.adjust ≤ 0.01) from all groups were processed as described in the Methods section to visualise categories identified from the D2 or D3 treatment groups but not by the placebo. Heatmap tiles that are blank correspond to categories that did not meet the significance criteria applied during the processing. The complete networks for each differentially expressed group of genes are shown in Supplementary Data File 5 .

