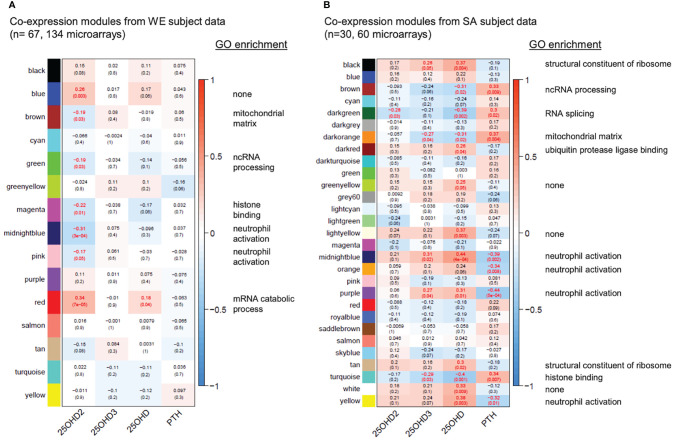
Figure 5.
Gene co-expression networks for the WE (A) and SA (B) ethnic groups. For each group of subjects, signed scale-free networks were constructed from the expression data using WGCNA to cluster probes with similar expression characteristics across all samples into discrete modules (colours on the y-axis: colours in (A, B) are independent). Module membership for the modules of genes identified in the WGCNA analysis of the data from the South Asian and white European cohorts are detailed in Supplementary Data File 6 . The colour scale to the right of each panel represents the Pearson correlation (from -1 to +1) between the expression profile for each module’s eigengene and the respective serum 25(OH)D2, 25(OH)D3, total 25(OH)D and PTH concentrations (x-axis). The Pearson correlation coefficients are also provided in each box, followed in brackets by an adjusted p-value, testing for the significance of each correlation. Statistically significant correlations (adjusted p-value ≤ 0.05) are indicated in red. A headline significant GO functional enrichment category (p.adjust ≤ 0.01) for each significant module is shown to the right; GO test results for each module are summarised in Supplementary Data Files 7 , 8 ).

