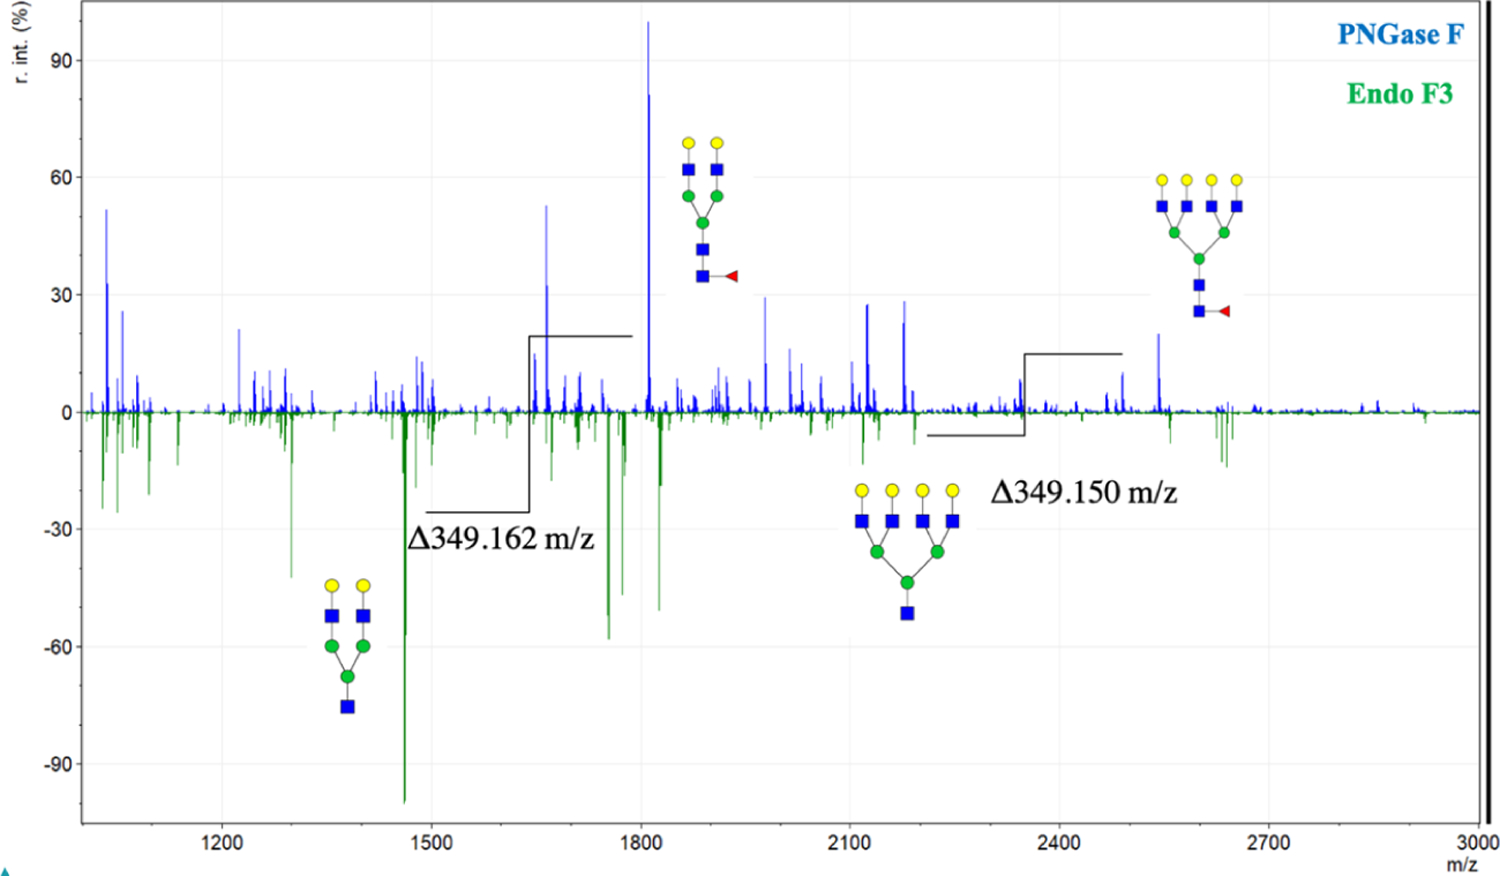
Figure 4.

Full mass spectra for prostate cancer tissues treated with Endo F3 and PNGase F. Full example mass spectra are represented for PNGase F (blue, top) and for Endo F3 (green, bottom) applied to prostate cancer tissues. Two major PNGase F fucosylated glycans and their Endo F3 counterparts are highlighted along with the observed corresponding mass shift. Further N-glycan identification from the corresponding mass spectra peaks can be found in the Supporting Information Table S1 for PNGase F and Supporting Information Table S2 for Endo F3.
