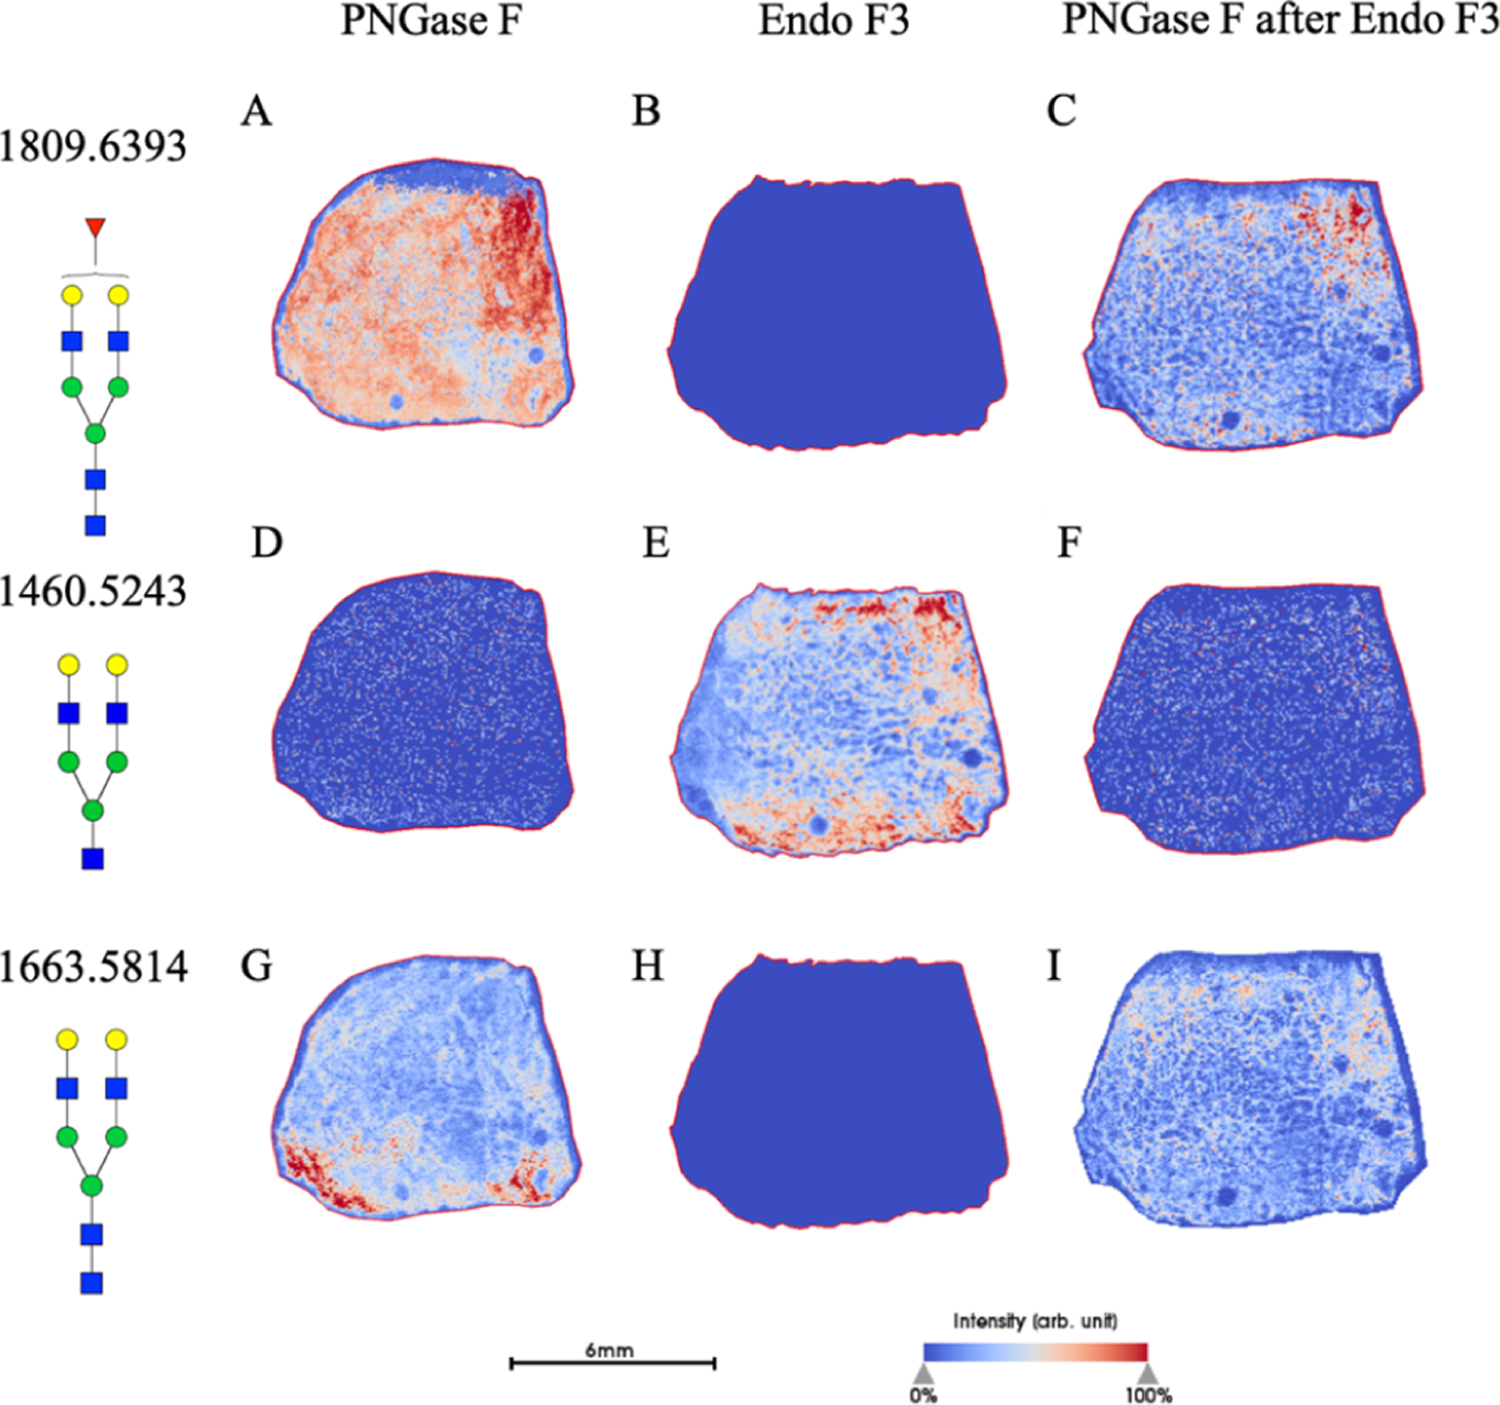
Figure 5.

Prostate cancer tissues analyzed upon multiple enzymatic digestions. A prostate cancer tissue section undergoing PNGase F treatment (A,D,G), Endo F3 treatment (B,E,H) or sequential PNGase F treatment following a wash of the Endo F3-treated tissue (C,F,I). A known core-fucosylated glycan, A2G2F distribution is shown for the PNGase F mass shift of 1809.6393 m/z (A−C) and for the Endo F3-treated, a mass shift of 1460.5023 m/z (D−F). Finally, high-mannose glycan Man8 (1743.5810 m/z) distribution is shown (G−I). Scale bar and intensity bar are included.
