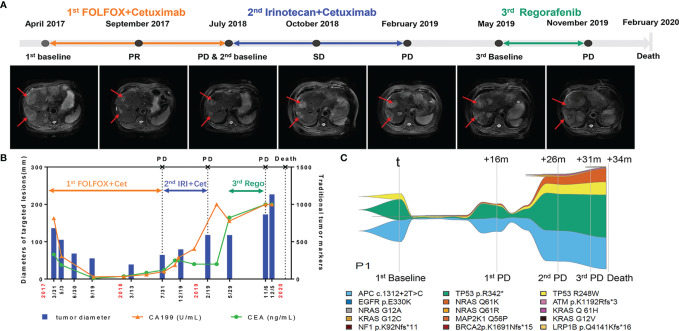
Figure 3.
Longitudinal radiograph and ctDNA detection of one representative CRC patient. (A) Radiographic features of tumor lesions in a 73-year-old male with colorectal cancer liver metastasis. PR, partial response; SD, stable disease; PD, progressive disease. (B) Comparison of the changes of tumor diameter, CEA and CA199 in patient 1(P1). Cet: Cetuximab; IRI, Irinotecan; Rego, Regorafenib. (C) Example of a serial ctDNA testing in P1 showing emergence of clonal alterations with treatment process. The changes of line thickness indicate the changes of variant allele frequency (VAF) of genomic alterations. The thicker line corresponds to larger VAF. Colors of specific genomic alterations shown on the bottom.

