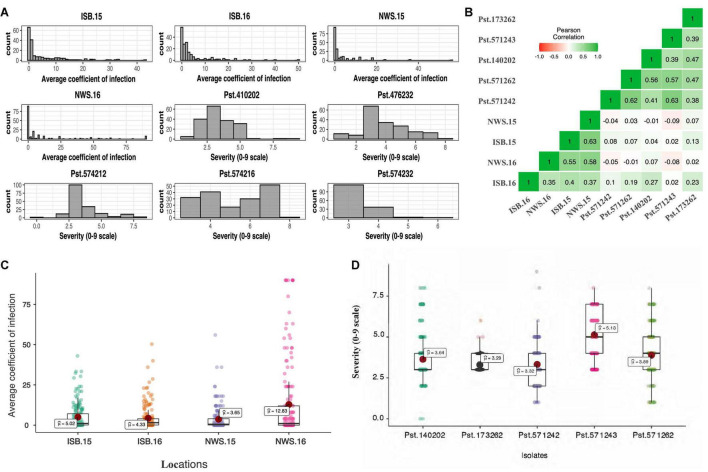
FIGURE 1.
Histogram showing frequency distribution for the average coefficient of infection (ACI) at four locations, viz. Islamabad-2015 (ISB.15), Islamabad-2016 (ISB.16), Nowshera-2015 (NWS.15), and Nowshera-2016 (NWS.16), and disease severity (0–9 scale) against five Pst isolates (A), boxplots for ACI at four locations (B), and disease severity against five Pst isolates (C), and coefficient of correlation across isolates and locations (D).

