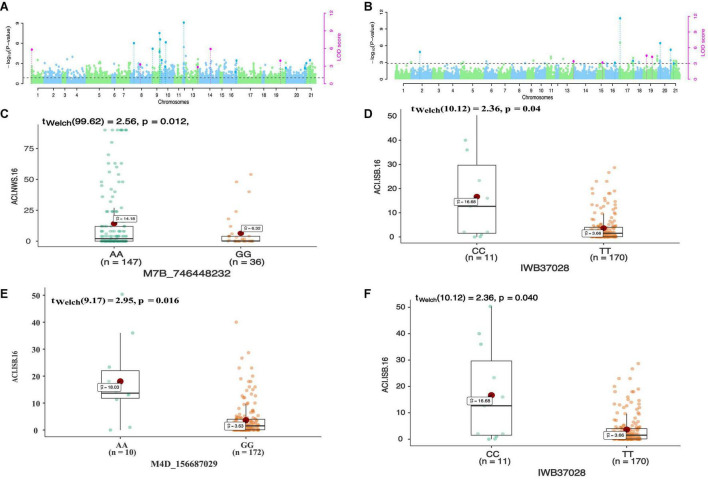
FIGURE 3.
Manhattan plots showing distribution of p-value on –log(10) scale for SNPs associated with an average coefficient of infection (ACI) at Nowshera-2016 (NWS.16) using 90K SNP array (A) and GBS markers (B). The allelic effects of SNPs on chr7B (C), chr6B (D), chr4D (E), and chr6B (F) are shown as boxplots. Each boxplot shows the distribution of the average coefficient of infection (ACI) in a relevant environment for both allelic states of the SNP marker.

