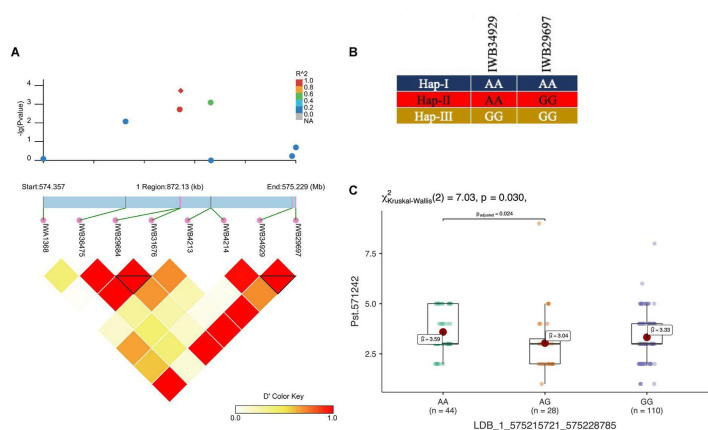
FIGURE 7.
LD haplotype block with SNP positions (A), variants of haplotype block (B), and allelic effect of different haplotypes on resistance against Pst.571242 in the block for LBD_1_575215721_575228785 on chr1A (C). Each boxplot shows the distribution of the average coefficient of infection (ACI) in a relevant environment for all allelic states of the SNP marker.

