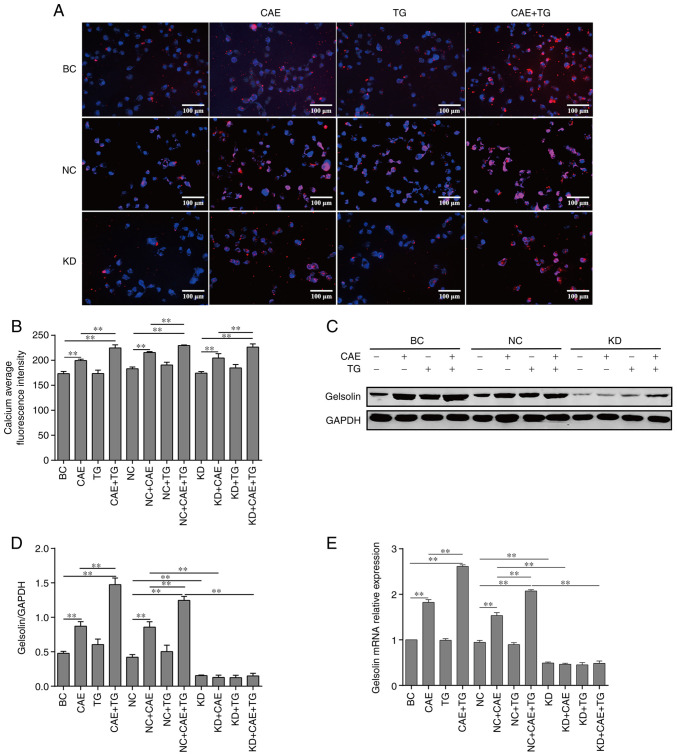
Figure 1.
Effect of intracellular calcium levels on GSN expression in HPDE6-C7 cells treated with CAE and TG. (A) Changes in intracellular calcium levels based on fluorescence imaging (x200 magnification) and (B) semi-quantitative analysis. (C) Protein expression levels of GSN, as determined by western blotting and (D) semi-quantitative analysis. (E) Relative mRNA expression levels of GSN, as determined by reverse transcription-quantitative polymerase chain reaction. The experiments were repeated at least three times. Data are presented as the mean ± standard deviation. **P<0.01. BC, blank control; CAE, caerulein; GSN, gelsolin; KD, knockdown; NC, negative control; TG, triglycerides.

