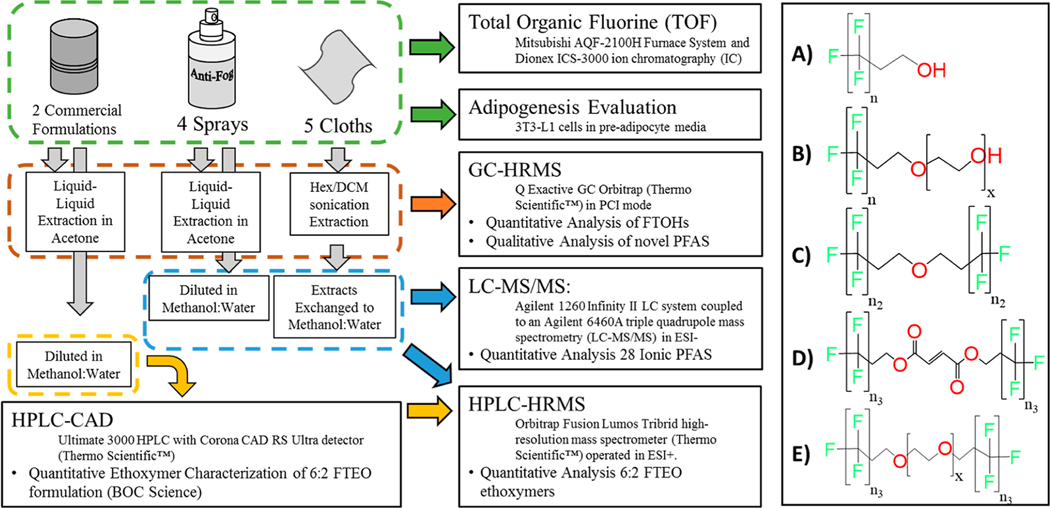
Figure 1.
Analytical workflow for sample analysis (left) and chemical structures identified in anti-fog products (right). A represents FTOHs, B represents FTEOs, C represents fluorotelomer ethers, D represents fluorotelomer fumarates, and E represents FTEO ethers. Compounds were identified with n as 6, 8, 10, 12, 14, or 16; n2 as 6, 8, or 10; n3 as 6; and x ranging from 1 to 8 via GC–MS analysis and from 2 to 13 via LC-MS analysis.

