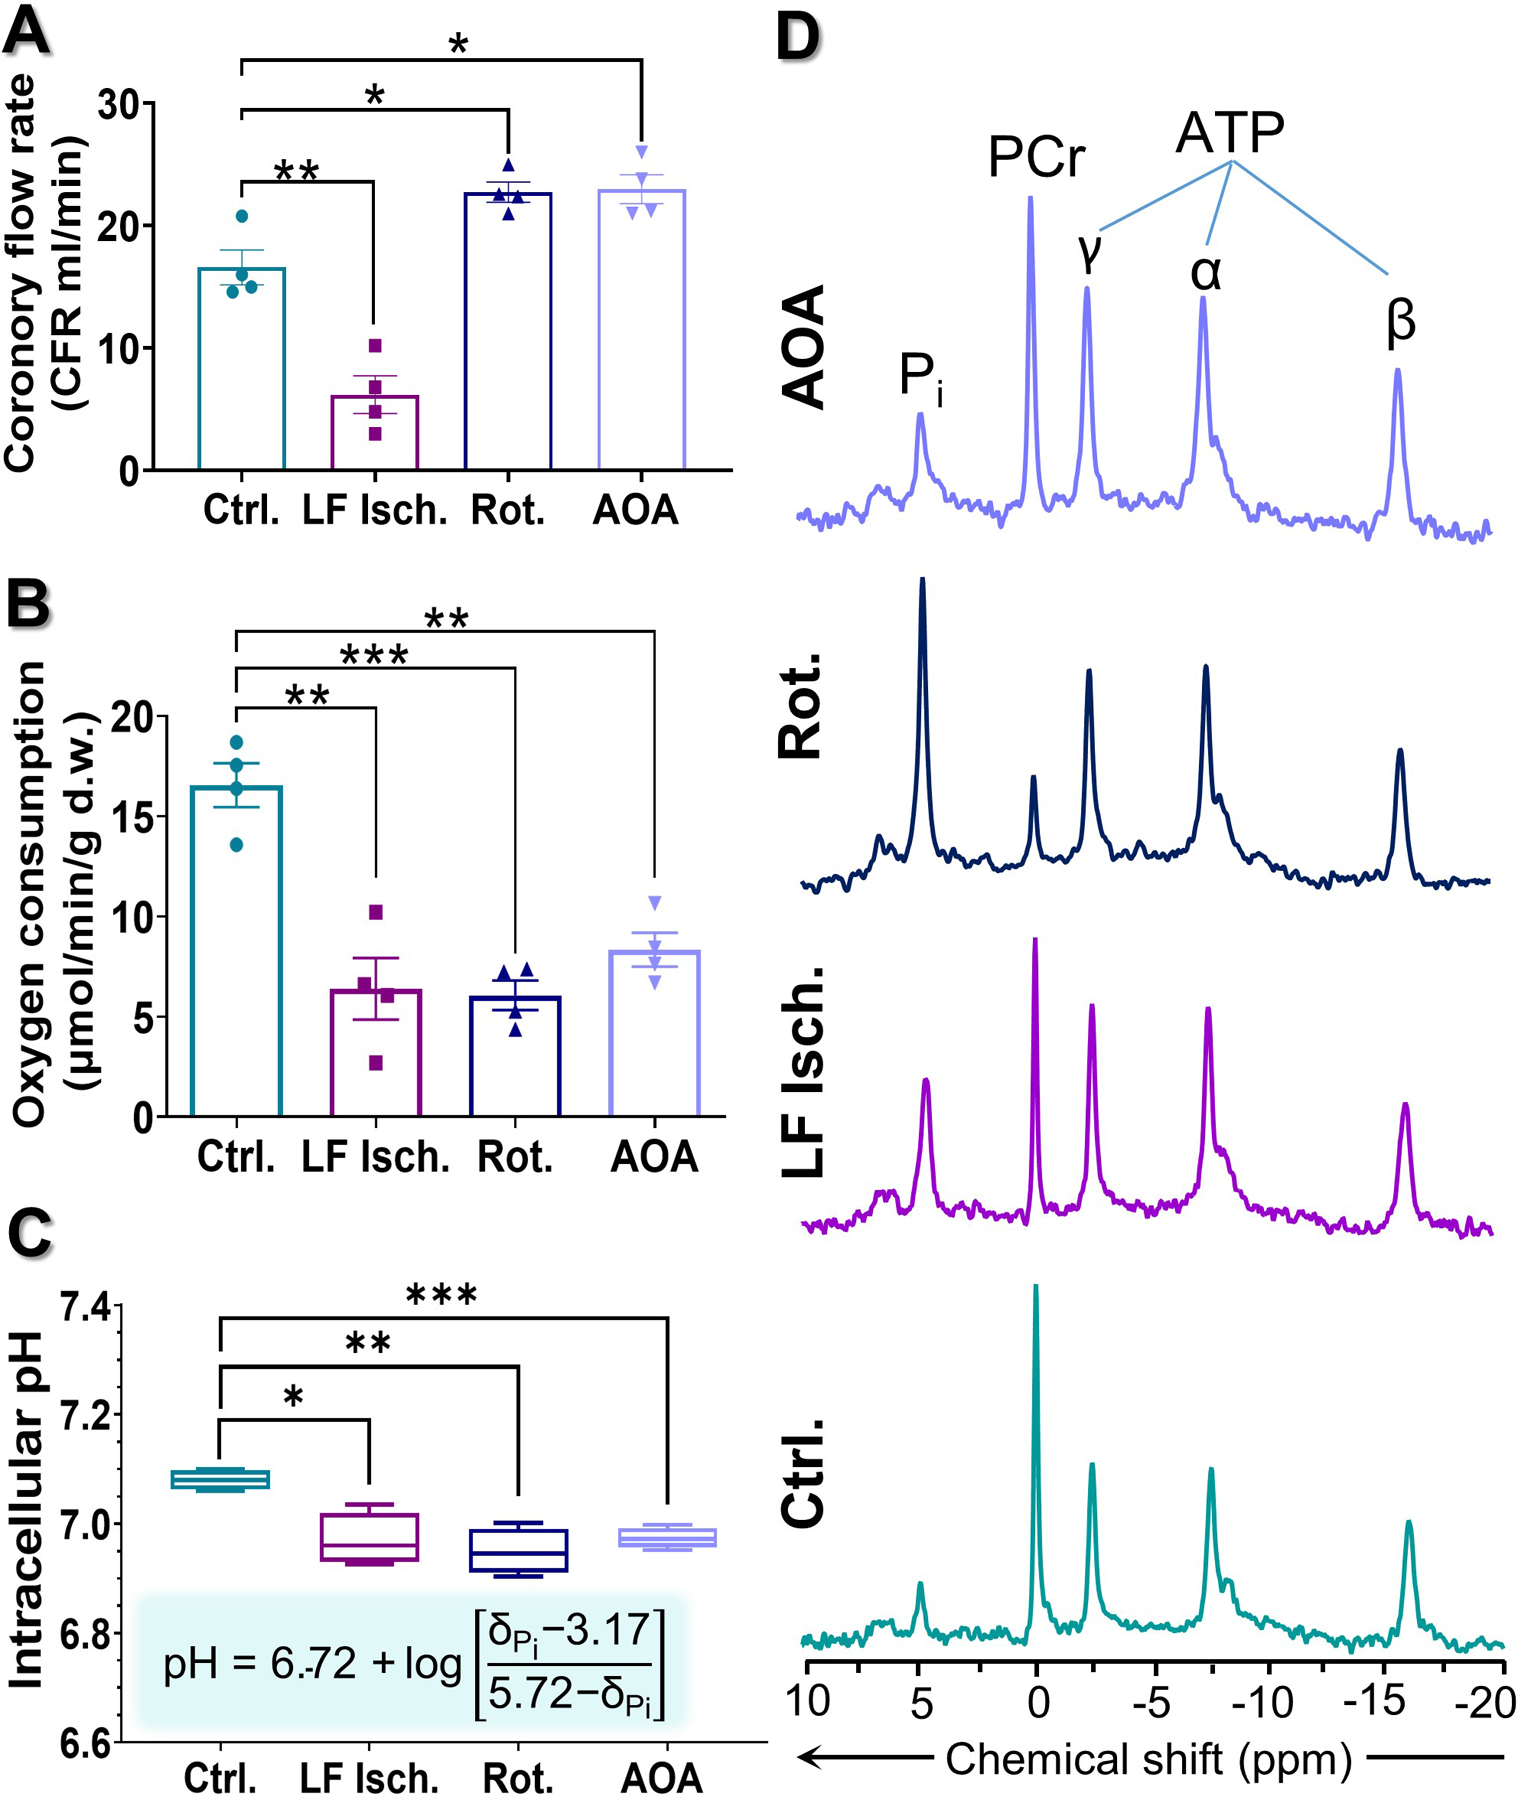
Figure 2.

Plots indicating (A) coronary flow rate, (B) myocardial oxygen consumption, and (C) intracellular pH of the hearts during perfusion. (D) 31P NMR spectrum of control, low-flow ischemia, rotenone-treated, or AOA-treated perfused heart. Intracellular pH values were calculated using the modified Henderson–Hasselbalch equation from the chemical shift of inorganic phosphate (Pi) 31P resonances. Data are shown as the mean ± SEM (n= 4) with statistical significance of differences indicated by “*” (P < 0.05), “**” (P < 0.001), and “***” (P < 0.0001).
