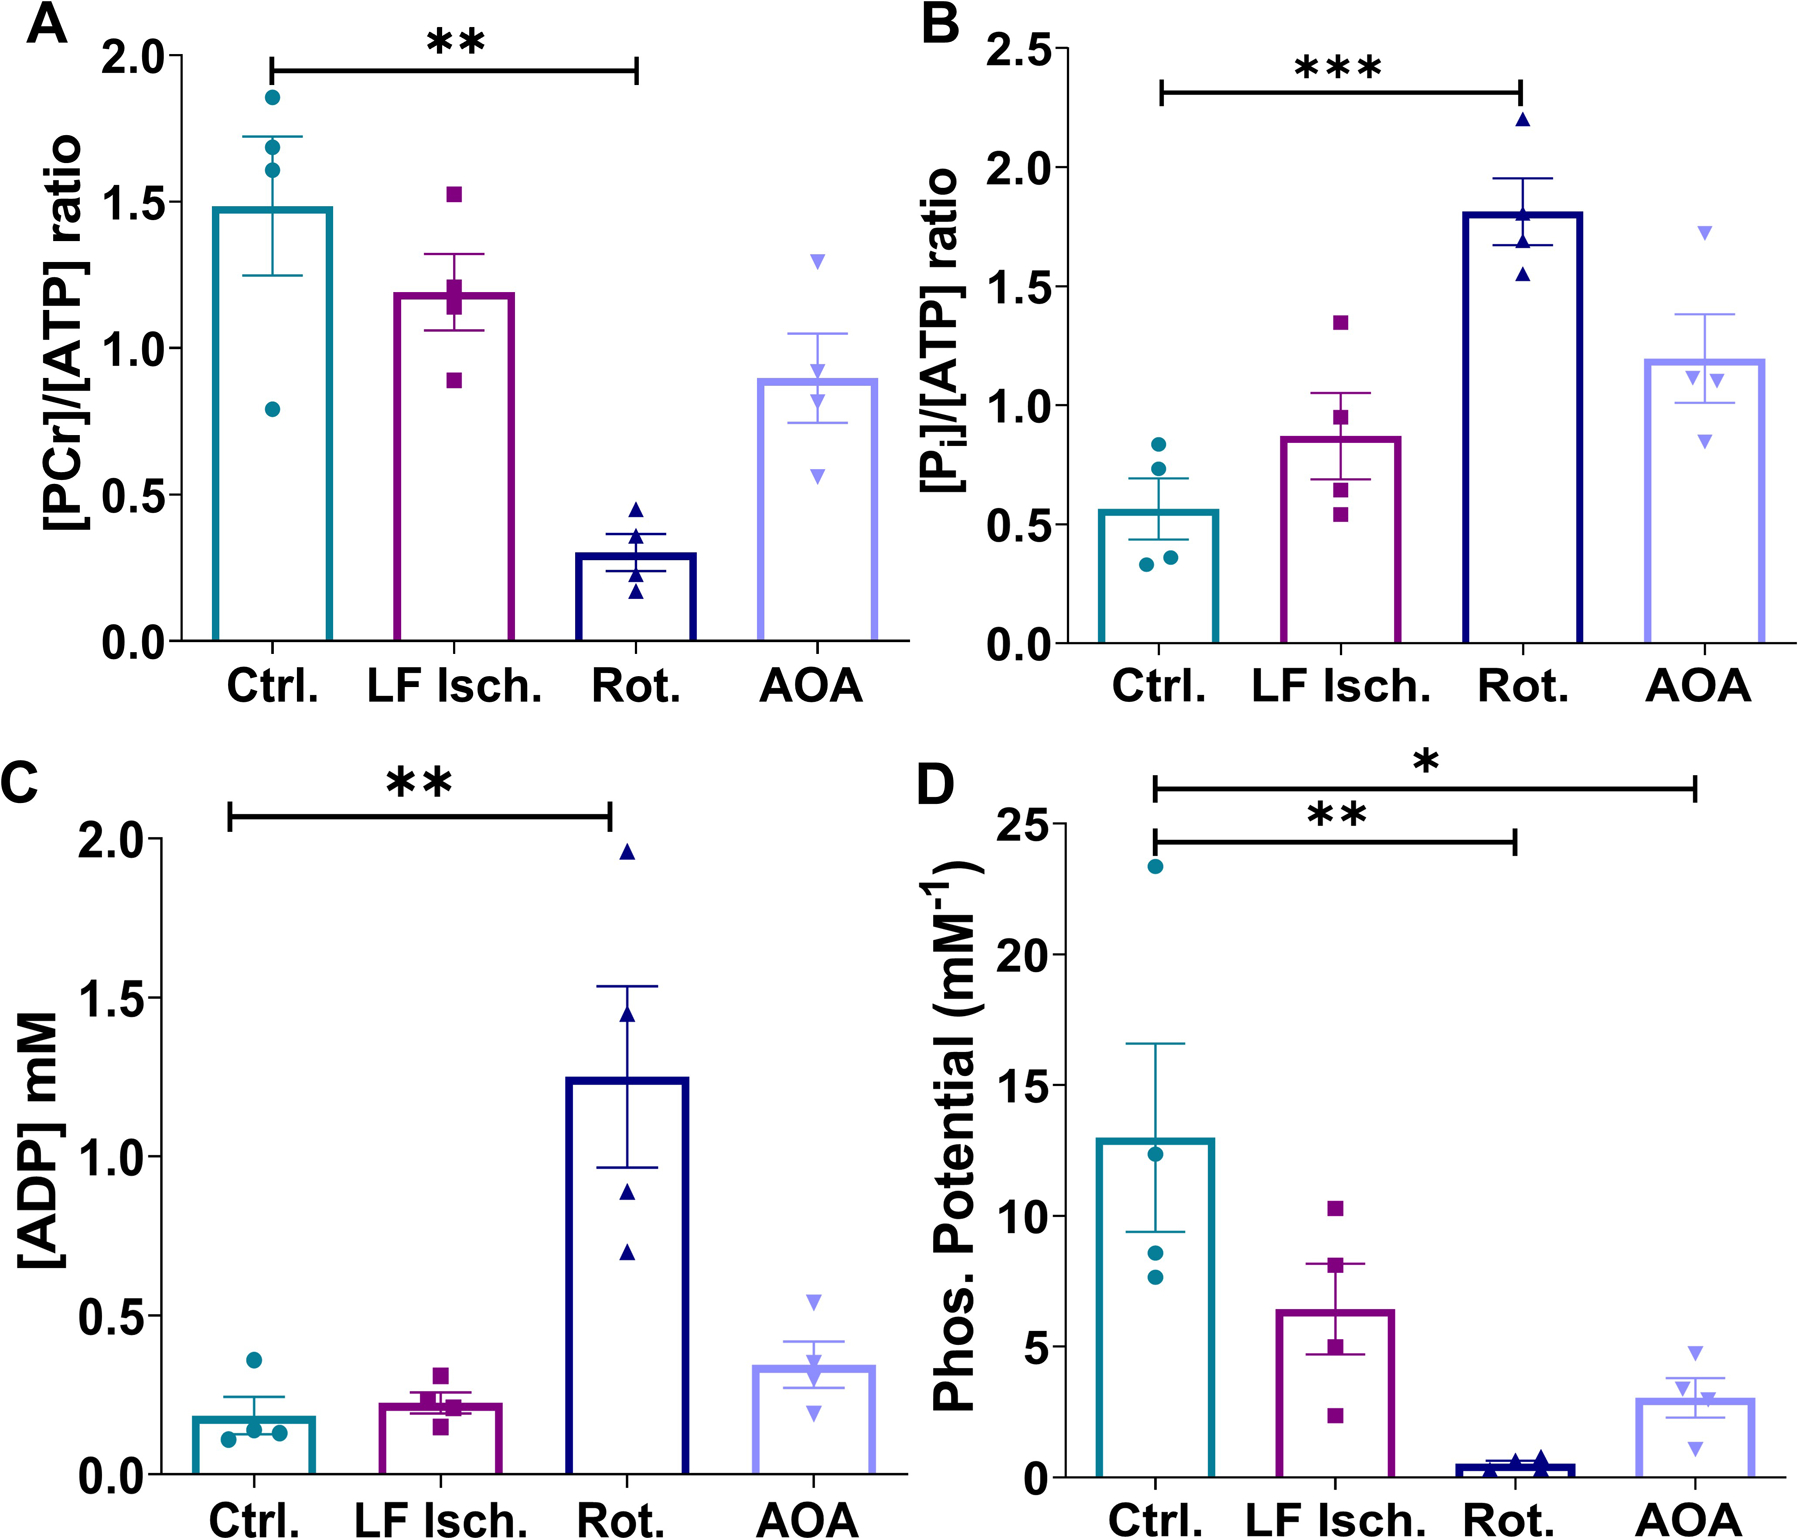
Figure 3.

Bar graphs showing phosphocreatine to ATP ratio (A), inorganic phosphate to ATP ratio (B), estimated ADP concentration (C), and phosphorylation potential (D) of all four groups of perfused hearts. The metabolite ratios were calculated from 31P NMR signal intensities, corrected for T1 decay, according to previously published methods 68, 69. [ADP] and phosphorylation potential were calculated using methods previously reported by Clarke et al.29. Data are shown as the mean ± SEM (n= 4) with statistical significance of differences indicated by “*” (P < 0.05), “**” (P < 0.001), and “***” (P < 0.0001).
