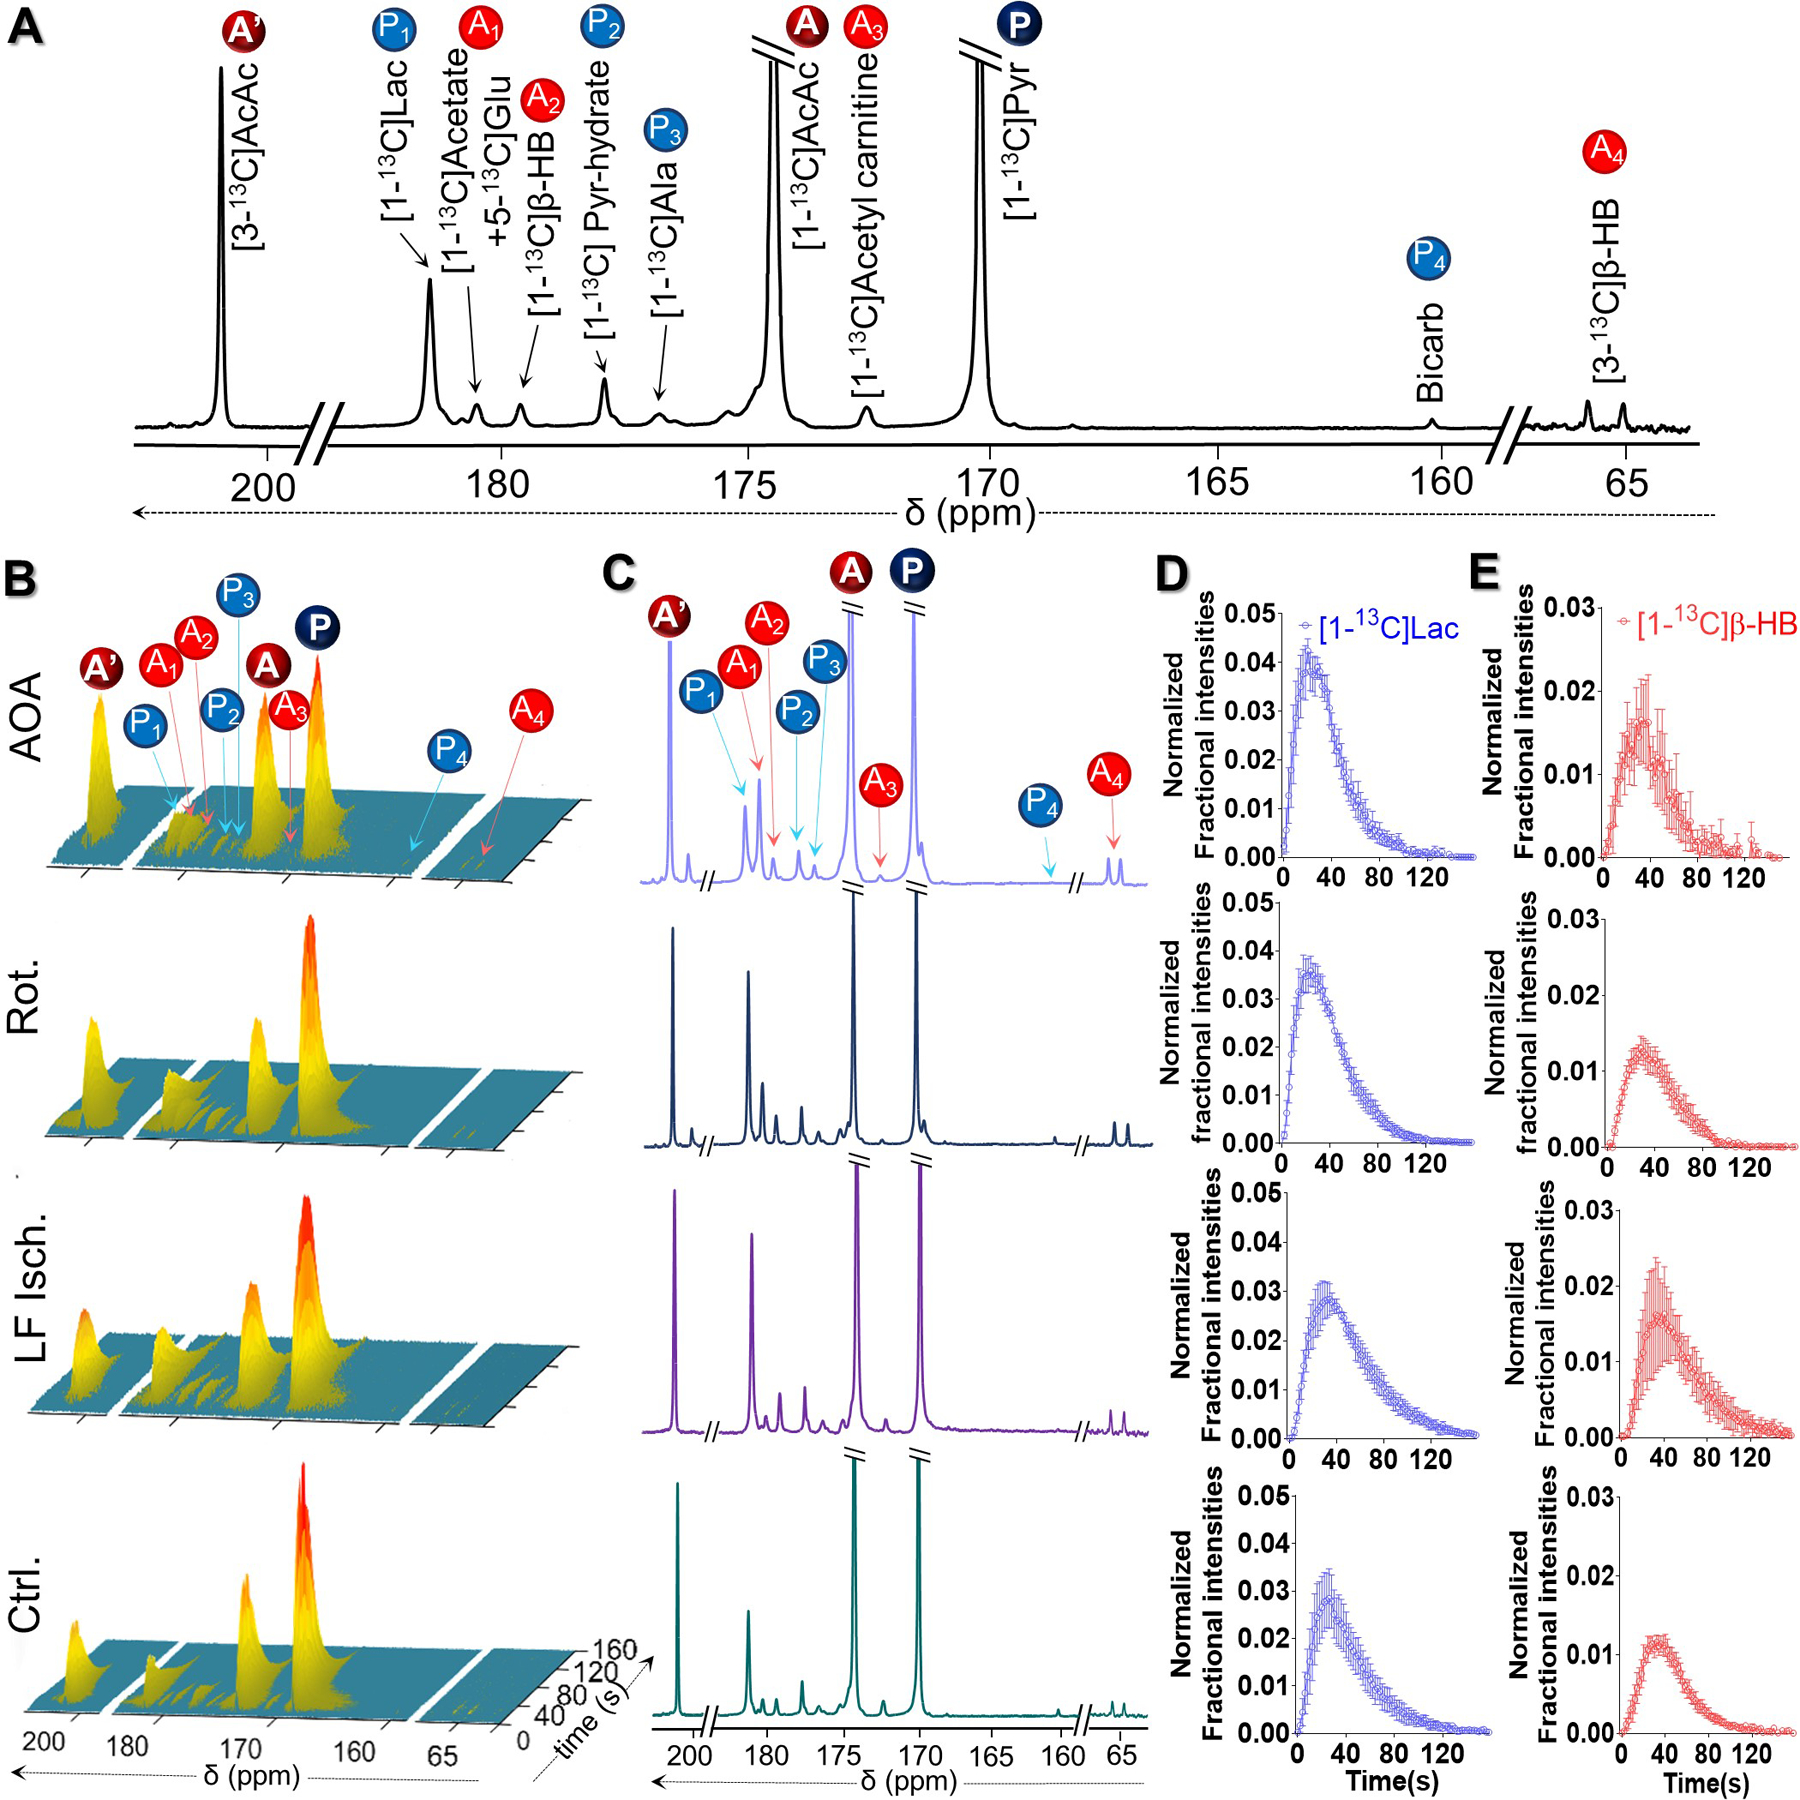
Figure 4.

(A) Representative 13C NMR spectra of a perfused rat heart injected with co-polarized [1-13C]pyruvate and [1,3-13C2]AcAc, showing resonances of [1-13C]pyruvate (P), [1,3-13C2]AcAc (A and A´), and their downstream metabolites. P1-P4 = metabolic products of [1-13C]pyruvate; A1-A4 = metabolic products of [1,3-13C2]AcAc. (B) Representative sequential 13C NMR spectra, displayed as stacked plots, of the perfused hearts following the injection of co-polarized [1-13C]pyruvate and [1,3-13C2]AcAc. Each spectrum was acquired every 2 s. Corresponding summed spectra of these arrays are shown in panel (C). Averaged normalized signal intensities (4 hearts per group) of HP [1-13C]lactate and C-1 of HP [1,3-13C2]β-HB plotted as a function of perfusion time are shown in panels (D) and (E), respectively. At a given time point, the HP [1-13C]lactate signal was normalized to the total HP 13C signals of downstream metabolites originated from HP [1-13C]pyruvate summed over the NMR acquisition time window for each heart, ~150 s. Meanwhile, the HP [1-13C]β-HB signal was normalized to the total metabolites originated from HP [1,3-13C2]AcAc during the same time window.
