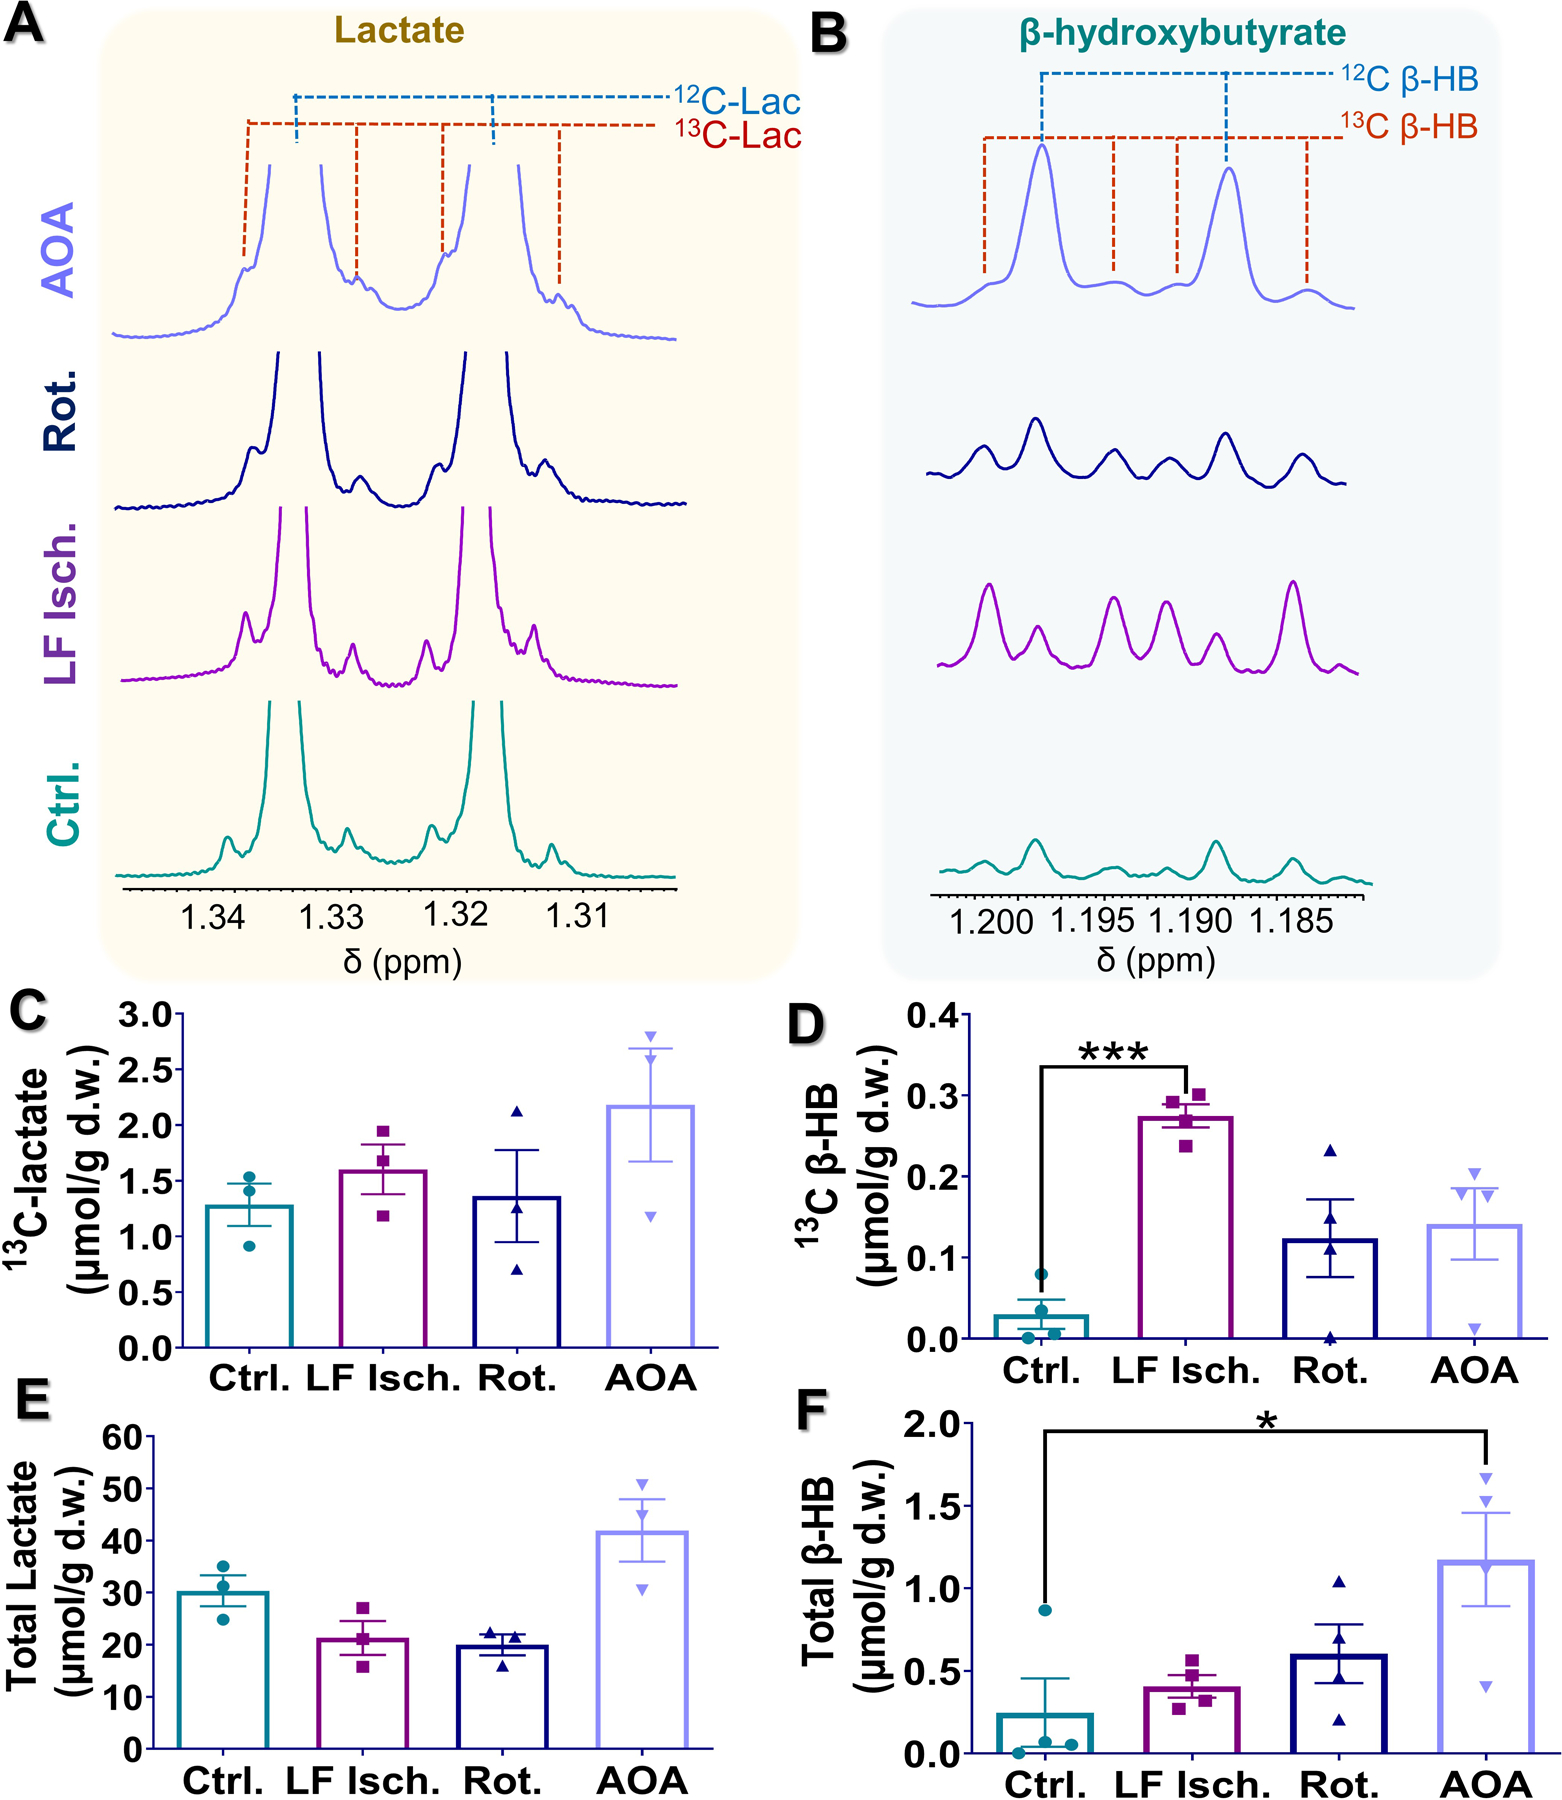
Figure 6.

(A-B) Representative high-resolution 1H NMR spectra of tissue extracts of hearts perfused under different conditions. For each spectrum, methyl resonances of lactate and β-hydroxybutyrate are shown. (C-F) Average tissue lactate and β-hydroxybutyrate concentrations quantified from the 1H NMR spectra are shown in. Tissue concentrations are shown as the mean ± SEM (n = 4) with statistical significance of differences indicated by “*” (P < 0.05) and “***” (P < 0.0001).
