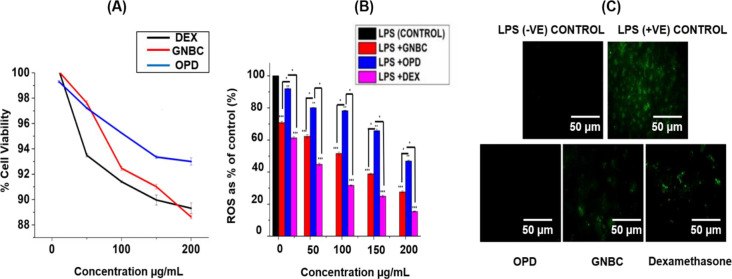
Figure 2.
(A) Cell viability of GNBC in RAW 264.7 cell line in comparison with standard dexamethasone drug and OPD (onion peel fractionate) (B) reactive oxygen species (ROS) scavenging assay in RAW 264.7 cells in bar diagram, (C) fluorescent images of ROS scavenging assay. Data represent the results of experiments conducted in triplicates, n = 3. Values are the mean ± standard deviation of three independent experiments. The statistical significance of the difference between treated and control groups was analyzed using one-way ANOVA followed by all pairwise multiple comparison procedures (Student–Newman–Keuls method). An asterisk (*) represents a significant difference when compared to control values at *p < 0.05 (*p < 0.05; **p < 0.01; ***p < 0.001).

