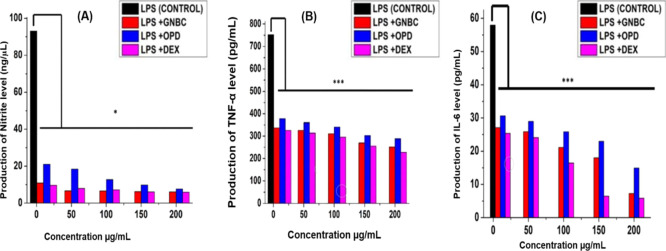
Figure 5.
(A) Nitrite production assay in LPS treated RAW cells (B,C) Effects of GNBC and OPD in the production of TNF-α and IL-6 in RAW 264.7 cells respectively. Cells were pretreated with LPS (100 ng/mL) for 4 h and then subjected to various concentrations (10, 50, 100, 150, and 200 μg/mL) of GNBC, OPD (EA onion peel fractionate), and a standard Dexamethasone drug. For 24 h. Control was kept untreated only stimulated with LPS alone. Data represent the results of experiments done in triplicates, n = 3. Values are the mean ± standard deviation of three independent experiments. The statistical significance of the difference between treated and control groups was analyzed using one-way ANOVA followed by all pairwise multiple comparison procedures (Student–Newman–Keuls method). An asterisk (*) represents a significant difference when compared to control values *p < 0.05, ***p < 0.001 vs the control group (LPS alone) (untreated group).

