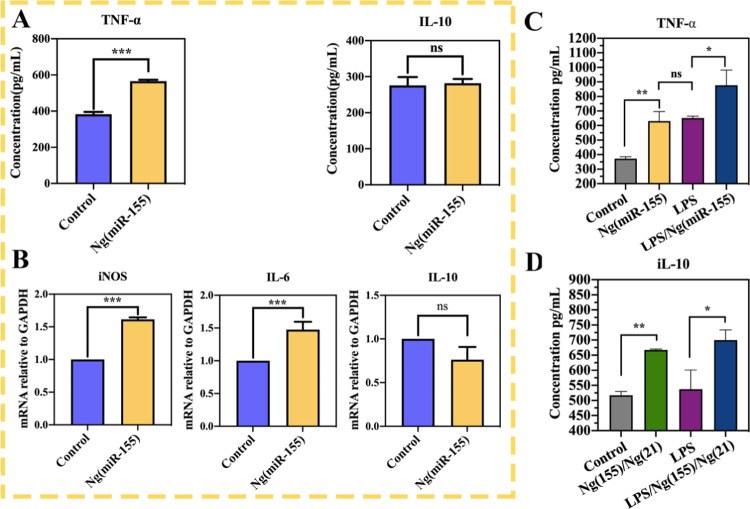
Figure 7.
(A) ELISA assay for TNF-α and iL-10 in the supernatant of RAW264.7 cells treated with Ng(miR-155). (B) Real-time PCR analysis of relative gene expression of the M1-related iNOS, IL-6, and M2-related IL-10. C and (D) Secretion of TNF-α and iL-10 after the sequential delivery of Ng(miR-155) and Ng(miR-21). *P < 0.05, **P < 0.01, and ***P < 0.001; ns indicates that the groups are not significantly different from each other.

