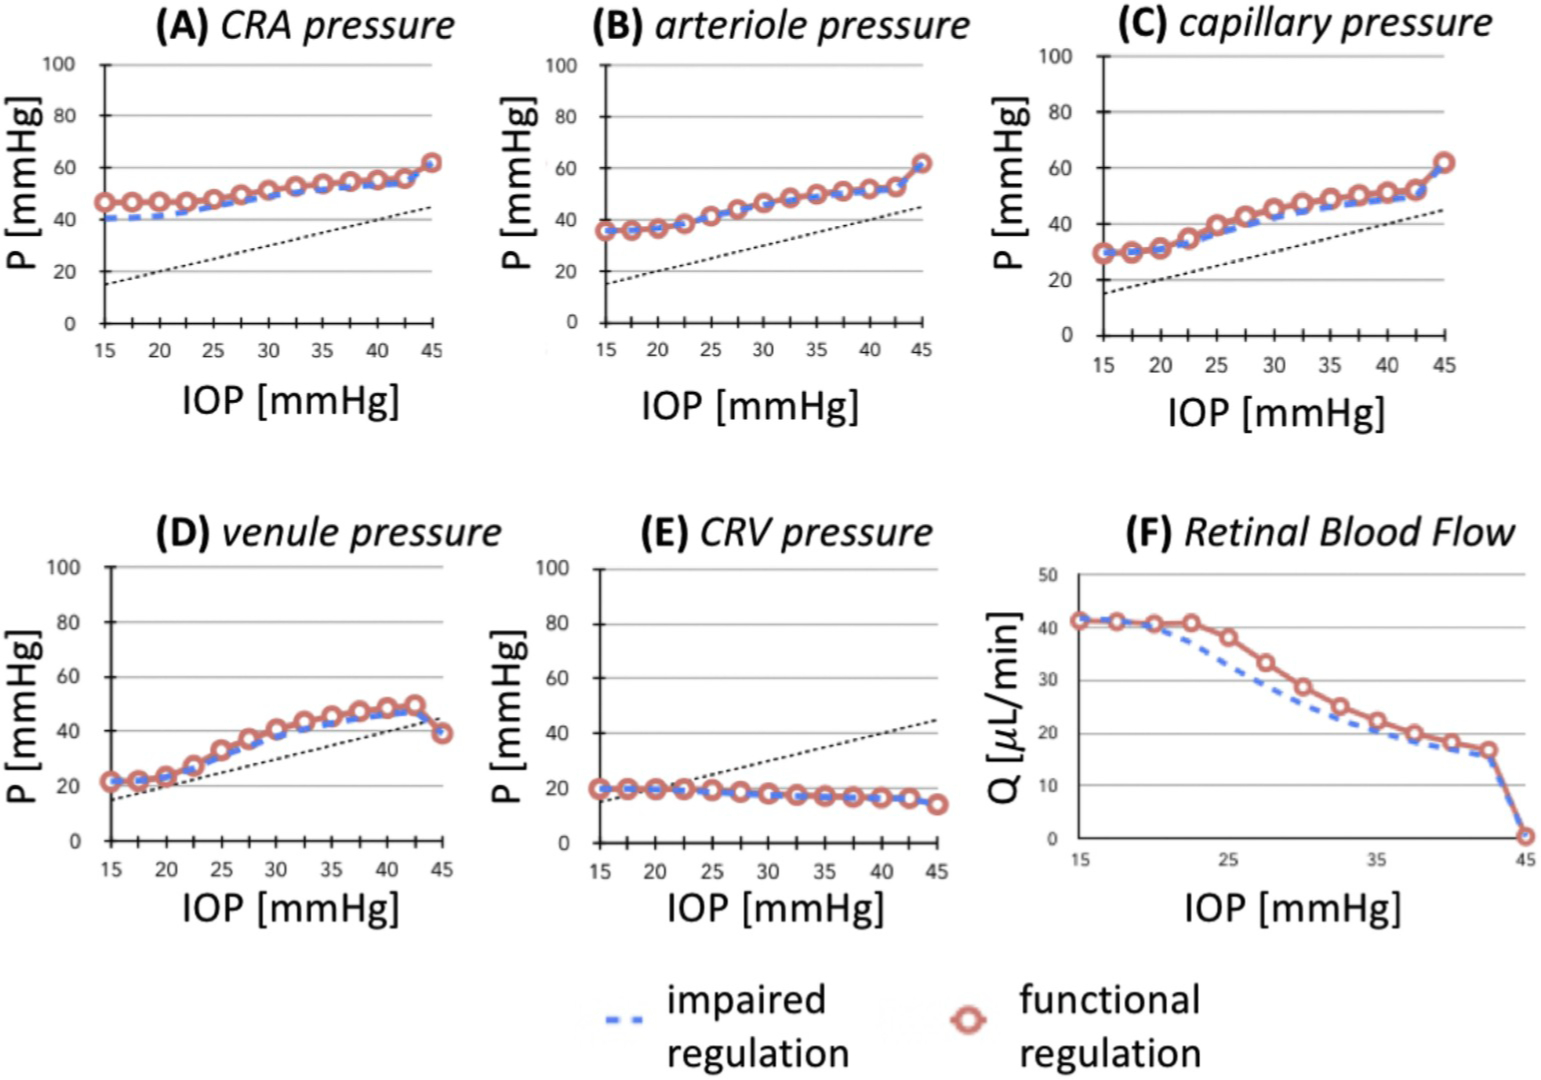
Fig. 4.

Simulation of hemodynamic variables predicted in the case of systolic and diastolic blood pressures equal to 120 mmHg and 80 mmHg, respectively, and intraocular pressure (IOP) varying between 15 mmHg and 45 mmHg. Image taken directly from (Chiaravalli, 2018), with permission. Intraluminal blood pressure (P) is predicted to increase with IOP in A) central retinal artery (CRA), B) arterioles, C) capillaries and D) venules. Panel E) shows that intraluminal pressure does not increase in the central retinal vein (CRV) located downstream of the lamina cribrosa. Predicted total retinal blood flow (Q) is portrayed in panel F). Results are reported in the case of functional active regulation (red circles) and impaired active regulation (blue lines). Overall, the results indicate the presence of a feedback hydraulic mechanism due to venous collapse that yields an intraluminal pressure increase upstream of the CRV, thereby aiding the retinal vasculature to better withstand IOP elevation.
