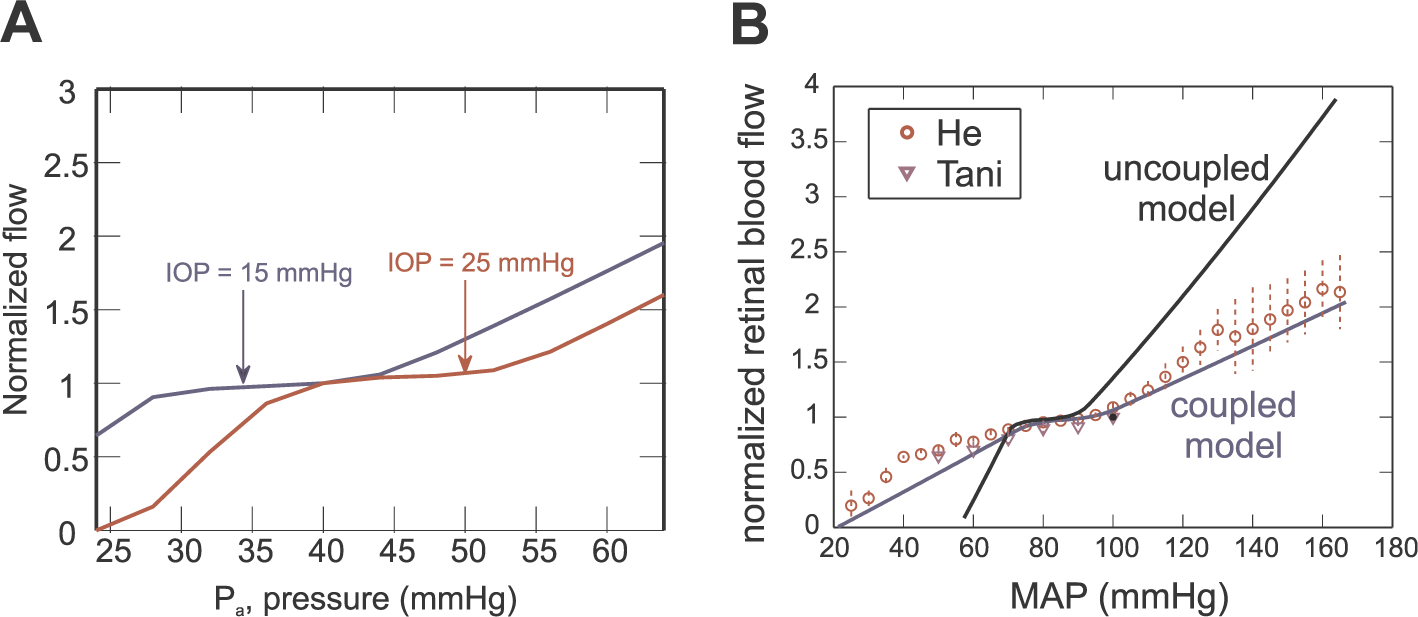
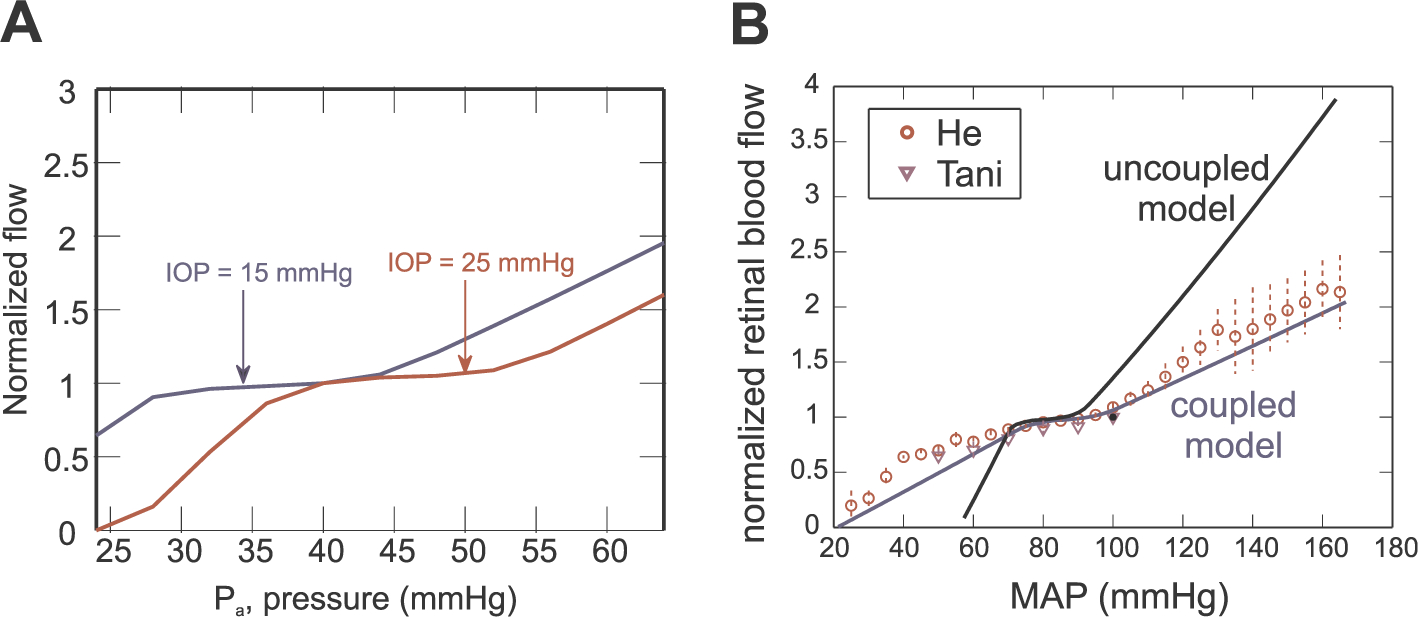
Fig. 6.


A) Model predicted autoregulation curves for IOP = 15 mmHg (control, blue) and IOP = 25 mmHg (elevated, red). Model predictions show autoregulation fails to operate over its expected pressure range when IOP is increased. Figure reproduced from (Arciero et al., 2013) with permission. B) Model predicted autoregulation curves predicted by the coupled model (blue) (Cassani et al., 2015) and the uncoupled model (black) (Arciero et al., 2013). Model predictions are compared with data from (He et al., 2012, 2013; Tani et al., 2014) as mean arterial pressure (MAP) is varied. Figure reproduced from (Cassani et al., 2015) with permission.
