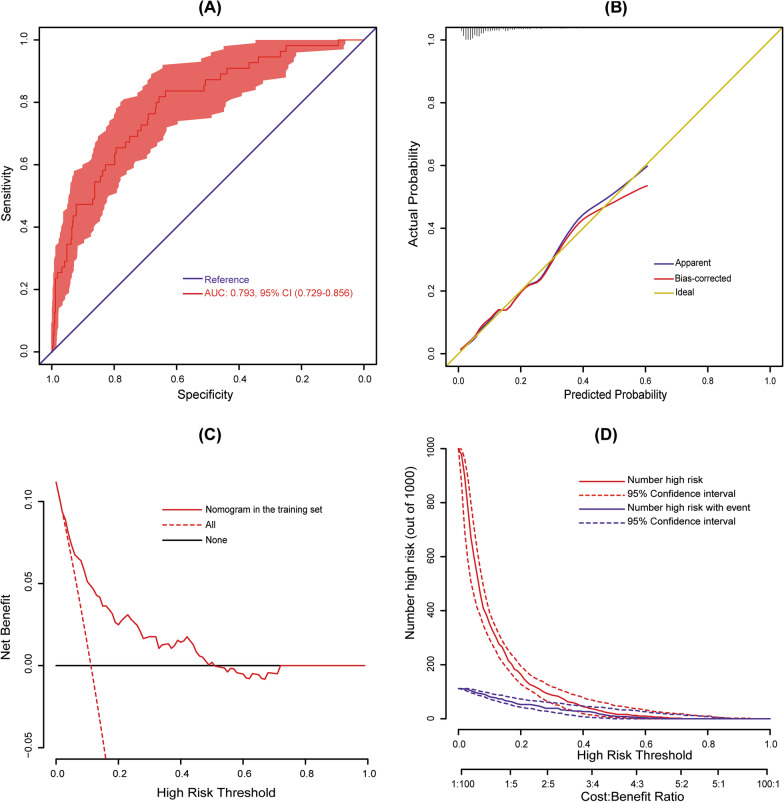
Fig. 3.
Assessment and validation of the nomogram. a ROC curve for the nomogram; b calibration plot of the nomogram. Ideal line represents perfect prediction that nomogram-predicted probability matches actually observed probability. c decision curves of the nomogram. Net benefit is plotted against various probability threshold; and d clinical impact curves of the nomogram. The total number of high-risk patients and the number of those with positive event are drawn against various risk threshold. ROC, receiver operating characteristic; AUC, area under the receiver operating characteristic curve; CI, confidence interval

