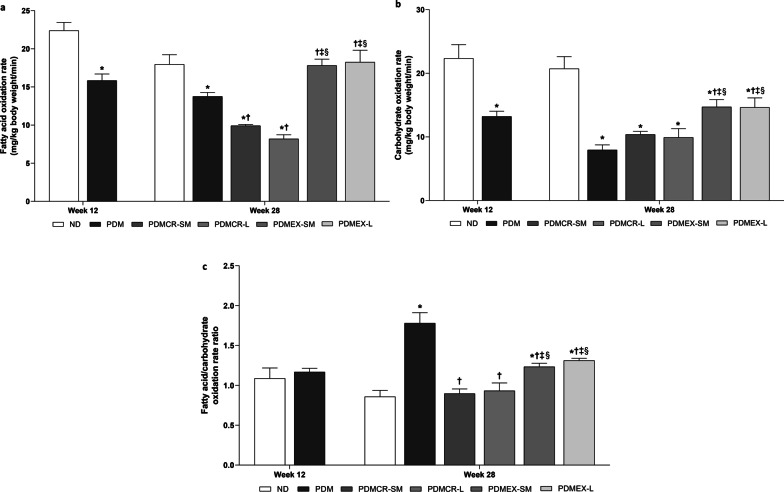
Fig. 3.
Fatty acid oxidation rate (a), Carbohydrate oxidation rate (b), Fatty acid/carbohydrate oxidation rate ratio (c). n = 5–6 per group. Data are reported as mean ± SEM. *p < 0.05 when compared to ND, †p < 0.05 when compared to PDM, ‡p < 0.05 when compared to PDMCR-SM, §p < 0.05 when compared to PDMCR-L, ‖p < 0.05 when compared to PDMEX-SM. ND: Normal diet; PDM: Prediabetes with no intervention; PDMCR-SM: Prediabetes with short-term caloric restriction followed by weight maintenance; PDMCR-L: Prediabetes with long-term caloric restriction; PDMEX-SM: Prediabetes with short-term exercise followed by weight maintenance; PDMEX-L: Prediabetes with long-term exercise

