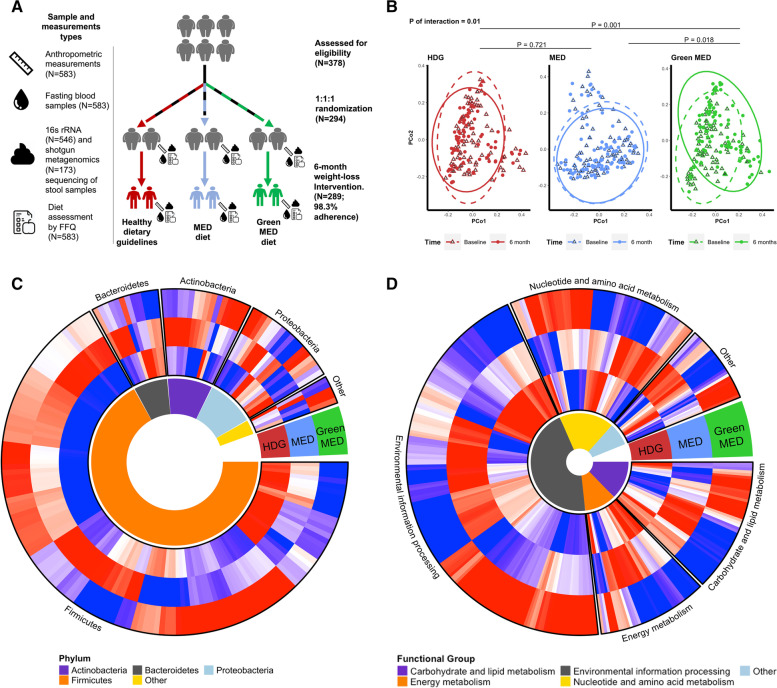
Fig. 1.
Changes in gut microbiome composition following 6-month dietary interventions. A Study design, adherence rate, and total sample count by category. B PCoA of all samples by group and time. The Green-MED group had undergone the most prominent compositional shift, with a significant interaction between group and time. P values denote the significance level of time-group interaction terms with all three groups (bold) and group-pair combinations by leave-one-out analysis (PERMANOVA). C, D Heatmap of changes in genus-level bacteria (C) and KEGG metabolizing modules (D) by lifestyle intervention group. For each cell, colors indicate the within-group change coefficient by MaAsLin2 between baseline and 6 months. The three dietary arms lead to distinct changes in patterns across genera and microbial metabolic pathways

