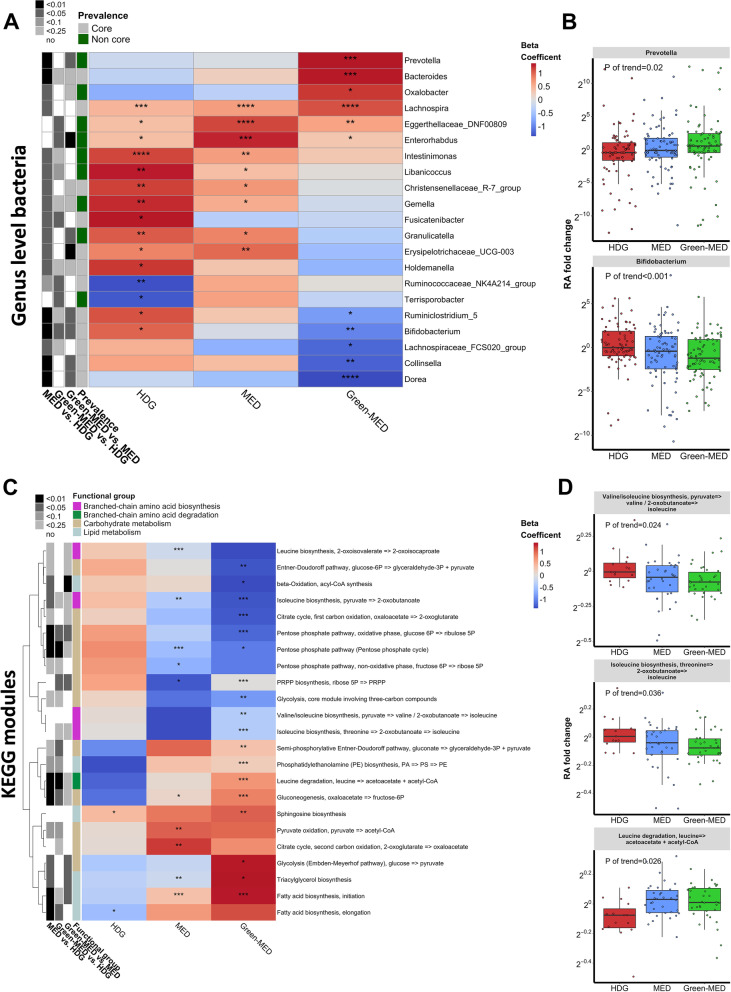
Fig. 3.
MED diets’ effects on microbial genera and metabolic pathways. A Heatmap of changes in genus-level bacteria by lifestyle intervention group, for taxa with significant time*group interaction. For each cell, colors indicate the within-group change coefficient over time and asterisks denote significance. Black-White annotations on the left denote the significance of between-group change difference (by MaAsLin2 time*group interaction). B Green-MED was distinguished by several changes, including an increase in Prevotella abundance and a decrease in Bifidobacterium. C Heatmap of changes in metabolism-related KEGG modules by lifestyle intervention group, for pathways with significant time*group interaction. For each cell, colors indicate the within-group change coefficient over time and asterisks denote significance. Black-white annotations on the left denote the significance of between-group change difference (by MaAsLin2 time*group interaction). Colors on the left denote the metabolism category. D The Green-MED diet was associated with increased BCAA degradation pathways and decreased BCAA biosynthesis. ****FDR < 0.001, ***FDR < 0.01, **FDR < 0.05, *FDR < 0.25

