Fig. 5.
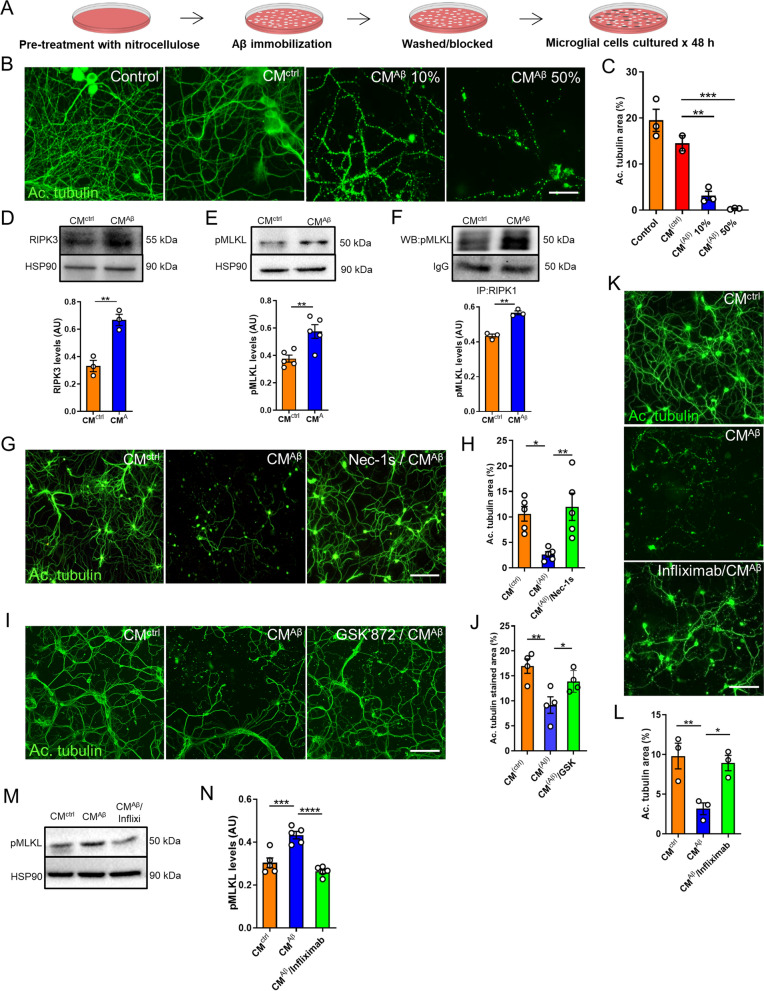
Neurodegeneration induced by conditioned medium from Aβo-stimulated microglia occurs via necroptosis activation. A Schematic representation of the preparation of the conditioned medium. B, C Representative images and quantitative analysis from neurons treated for 72 h with culture medium collected from a culture dish where Aβo were previously immobilized using nitrocellulose (control), neurons treated with conditioned medium from untreated microglia (CMctrl), and neurons treated with 10% and 50% conditioned medium from Aβo-stimulated microglia (CMAβ); immunostaining was performed with anti-acetylated tubulin antibody (scale bar, 50 μm). Western blot analyses of protein extracts from neurons treated for 6 h with CM were performed to determine the expression levels of RIPK3 (D) and pMLKL (E). Specific bands were quantified by densitometric analysis and expressed relative to HSP90 protein, represented in the graphs. F Protein extracts from neurons treated for 6 h with CM were immunoprecipitated with an antibody against RIPK1 and probed for pMLKL. The graph represents the densitometric analysis of the western blots. G, H Representative micrographs and quantitative measurements of neurons treated for 72 h with CMctrl, CMAβ and with Nec-1 s (30 μM) prior to the addition of CMAβ, immunolabeled with anti-acetylated tubulin antibody (scale bar, 200 μm). I,J Representative images and quantitative analysis of neurons treated for 72 h with CMctrl, CMAβ and with GSK’872 (1 μM) prior to the addition of CMAβ, immunolabeled with anti-acetylated tubulin antibody (scale bar, 200 μm). K, L Representative images and quantitative analysis of neurons treated with CMctrl, CMAβ, and with CMAβ that was previously mixed with Infliximab (0.01 μg/μl, Infliximab/CMAβ), immunostained with anti-acetylated tubulin antibody (scale bar, 200 μm). M, N Western blot analysis of protein extracts from neurons treated for 6 h under the indicated conditions was performed to determine the expression levels of pMLKL. Bands were quantified by densitometric analysis and expressed relative to HSP90 protein, represented in the graph. Each experiment was performed at least three independent times, with three replicates per condition each time. Data are presented as mean ± S.E.M. Data in C, H, J, L, and N were analyzed by one-way ANOVA followed by Bonferroni post-test. Data in D–F were analyzed by Student’s t-test. *p < 0.05; **p < 0.01; ***p < 0.001, ****p < 0.0001

