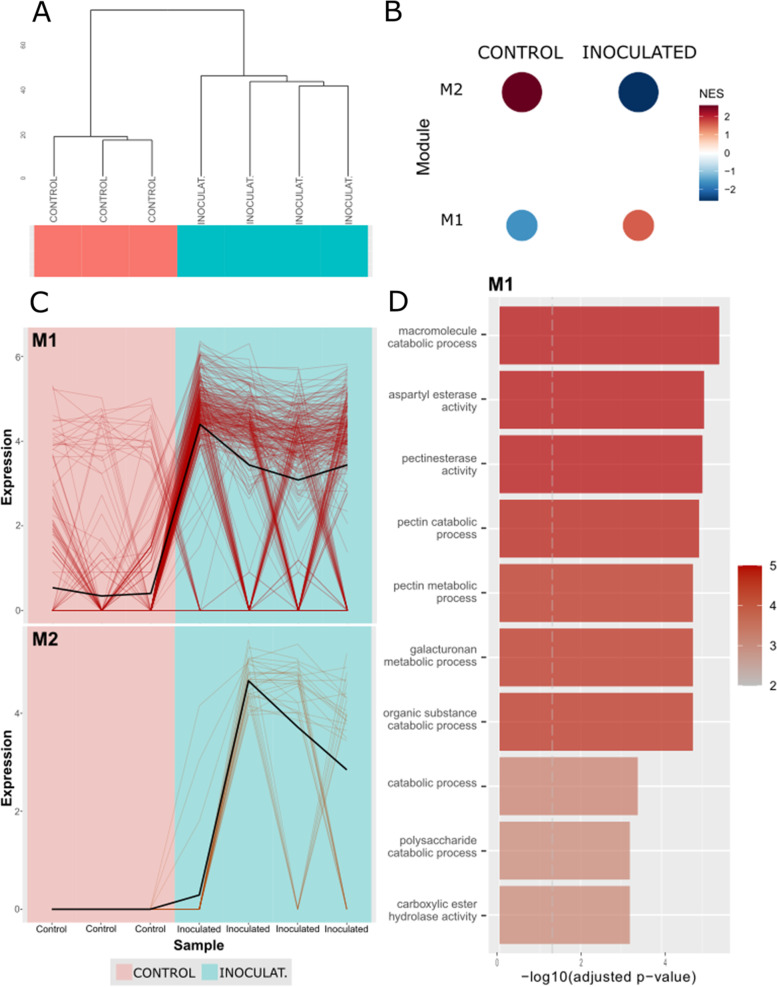
Fig. 6.
Two co-expression modules were identified among DE lncRNAs, DEGs and targeted genes using CEMiTool package. (A) Dendrogram of samples clustered according to their condition. (B) Gene set enrichment analysis (GSEA)-based identification of two gene co-expression modules. Red coloring denotes a positive NES score, while blue coloring denotes a negative NES score. (C) Expression profiles for both expression modules (M1, M2). Each line represents a transcript and its change in expression across conditions. (D) Barplot for top GO terms enriched in M1 module. x-axis and colour transparency display - log10 of the Benjamini-Hochberg (BH)-adjusted p-value. Dashed vertical line indicates BH-adjusted p-value threshold of 0.05

