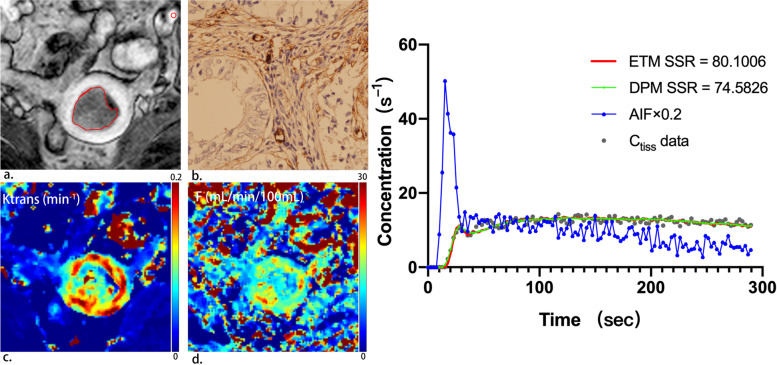
Fig. 1.
A 53-year-old patient with low-risk endometrial carcinoma. (a) On oblique axial DCE-MRI, tumor is delineated by red line and AIF is delineated by red circle. (b) Immunohistochemical staining with CD105 (magnification 400) showed 14 microvessels per mm2 indicating low microvessel density in the tumour. (c) Parametric map of transfer constant (Ktrans) for the extended Tofts (ET) model. The mean value of Ktrans for the tumor was 0.12 min-1, indicating relatively high permeability. (d) Parametric map of blood flow (F) for the distributed parameter (DP) model. The mean value of F for the tumor was 13.74 mL/min/100 mL, indicating relatively high blood flow. (e) Example of fitting a voxel tissue concentration (Ctiss)–time curve with the extended Tofts (ET) model and the distributed parameter (DP) model (right panel). Smaller sum-of-squared residue (SSR) is indicative of better fit. The ET and the DP model yield similar SSR values

