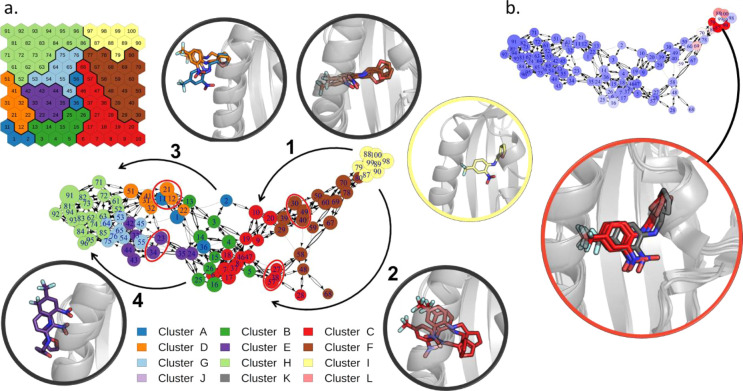
Figure 3.
Transition network for the SMD simulations of THS-020 unbinding from HIF-2α. (a) Transition network with its main ramifications explicitly indicated by black arrows (nodes are colored according to the SOM clusters). The representative conformations of neurons that characterize each branch (red circles in the network) and of the bound state (in yellow) are depicted in cartoons with the ligand in sticks. (b) Network colored according to the average SMD force of its frames (from blue to red, increasing values of this property), and the representative conformations of the neurons with the maximum forces, superimposed to the bound state (in gray).

