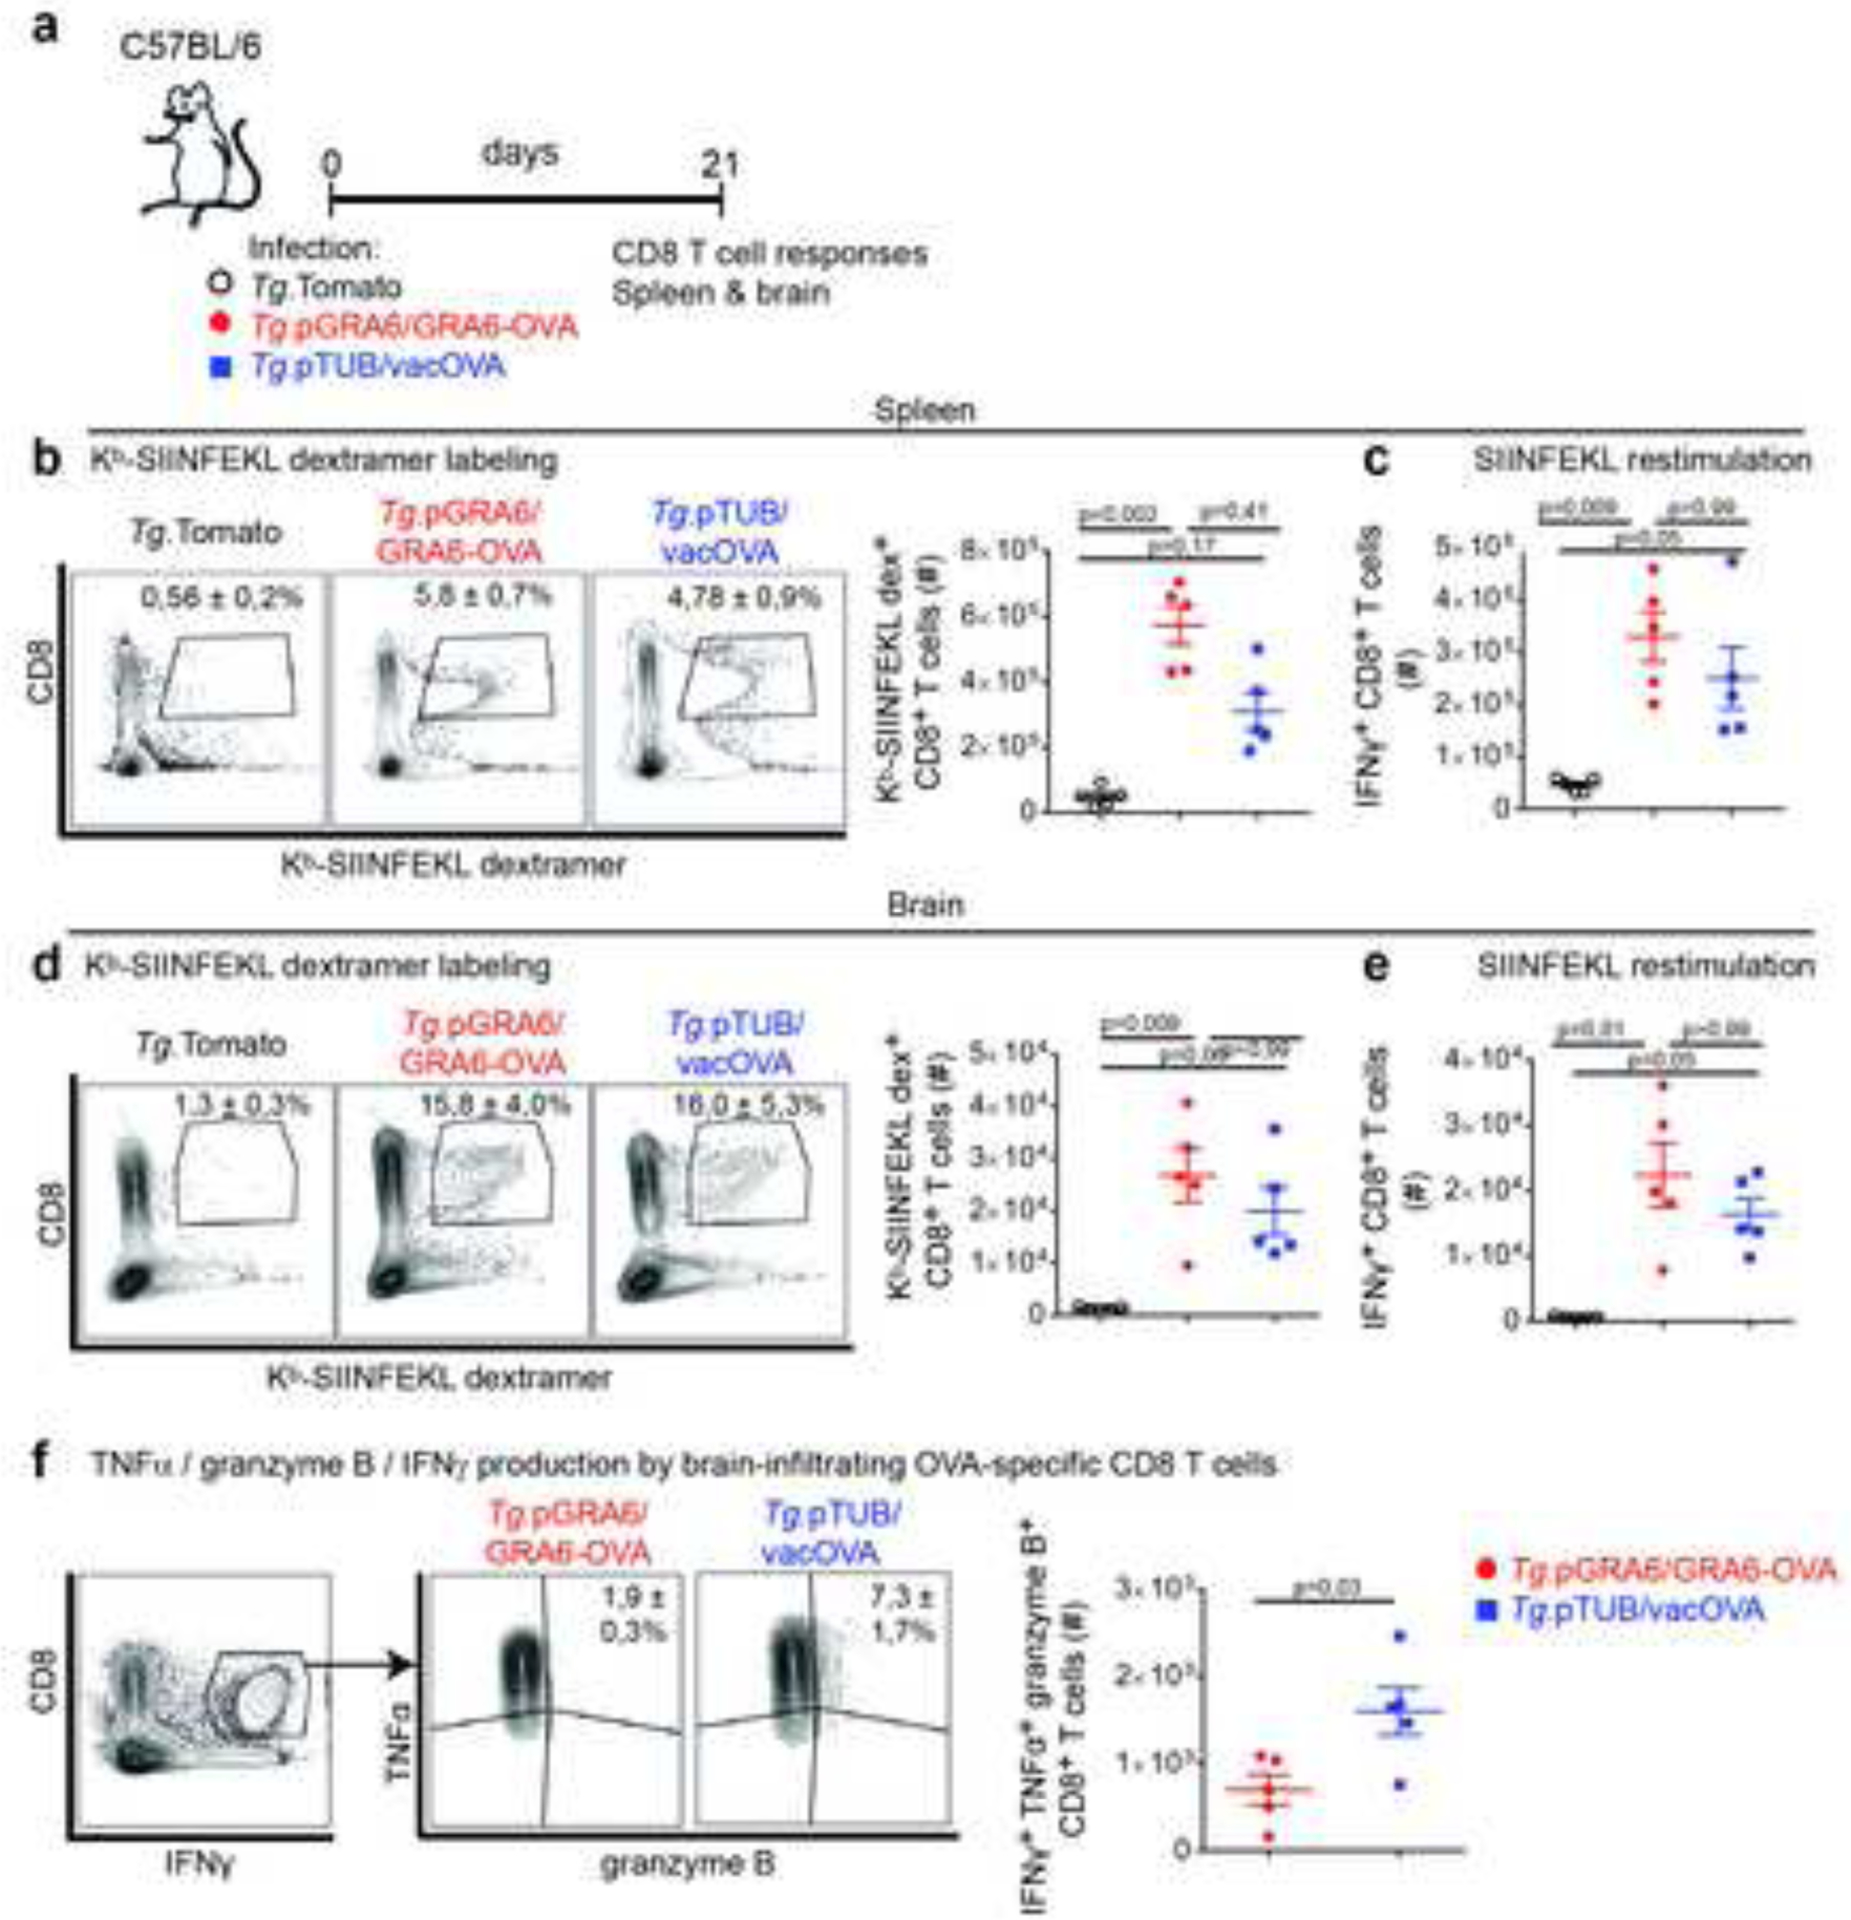
Figure 4. Defective control of vacOVA-expressing T. gondii is not due to improper mobilization and effector differentiation of CD8 T cells in CNS.

(a) Schematics of experimental infections in C57BL/6 mice infected i.p. with either of the 3 parasite strains. Evaluation of CD8 T cell responses in spleen and brain 3 weeks post-infection. (b, d) Kb-SIINFEKL dextramer labeling of spleen (b) and brain-infiltrating (d) CD8 T cells. Numbers on the representative contour plots show the mean percentage of dextramer+ out of CD8+ T cells +/− SD. Graph shows mean +/− SEM of absolute numbers. (c, e) Absolute numbers of IFNγ-producing CD8 T cells from spleen (c) and brain (e) following in vitro restimulation with OVA-derived SIINFEKL peptide (mean +/− SEM). (f) Analysis of triple-producing IFNγ+ TNF+ granzyme B+ brain CD8 T cells after restimulation with SIINFEKL peptide. Numbers on the representative contour plots show mean percentage of TNF+ granzyme B+ out of IFNγ+ CD8 T cells +/− SD. Graph shows absolute numbers of triple-producing CD8 T cells (mean +/− SEM). N=5 mice/ group. (b, c, d, e) Representative of 4 independent experiments. (f) Representative of 3 independent experiments.
