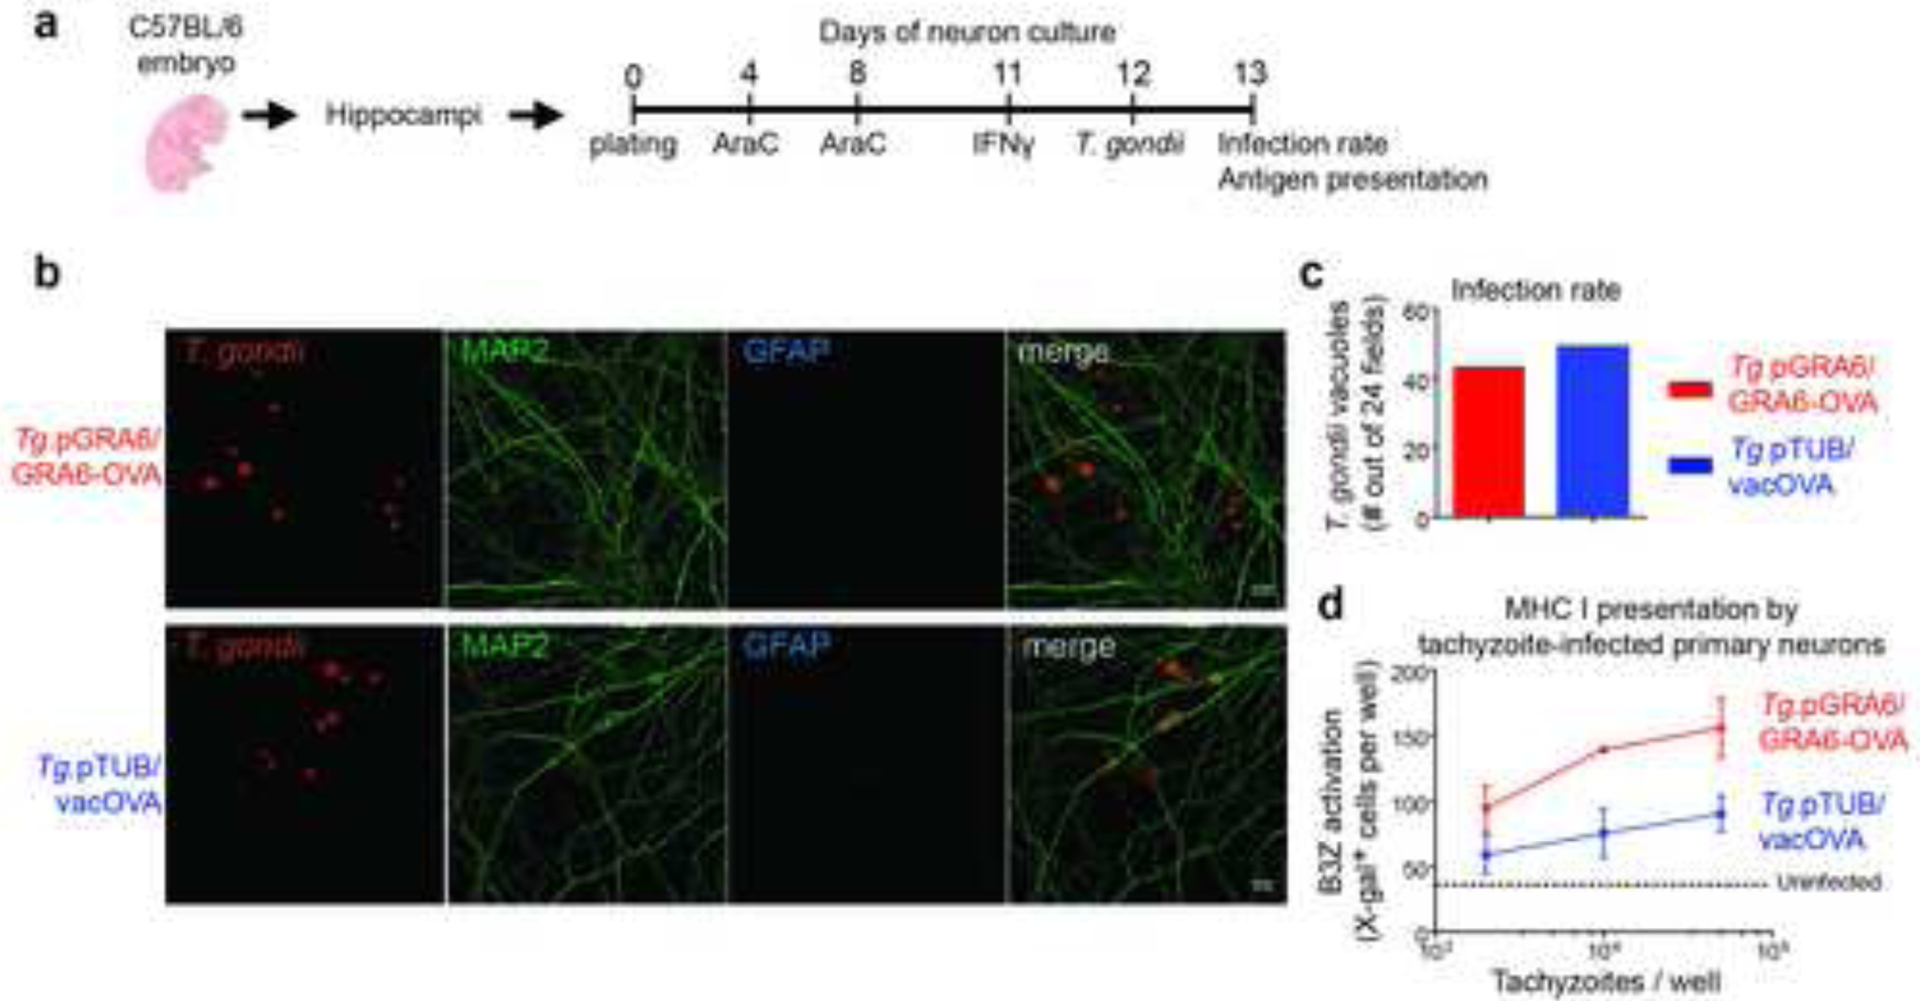
Figure 5. Poorer Kb-SIINFEKL presentation by neurons infected with T. gondii expressing vacOVA compared to neurons infected with T. gondii expressing GRA6-OVA.

(a) Timeline of antigen presentation assay with Tg-infected primary neuronal cultures. AraC was added to inhibit growth of glial cells. (b, c) Tropism and infection rate of the two Tomato+ parasites following co-staining with MAP2 (green) and GFAP (blue). Pictures represent maximum intensity projections. Out of 24 fields, no vacuole was detected in a glial cell. Scale bar 10 μm. (d) Kb–SIINFEKL presentation by primary neurons infected for 24 h with the indicated tachyzoites, assessed by absorbance measurements following incubation with SIINFEKL-specific LacZ-inducible B3Z CD8 T cell hybridomas. (b, c, d) Representative of 2 independent experiments. See also Figure S3.
