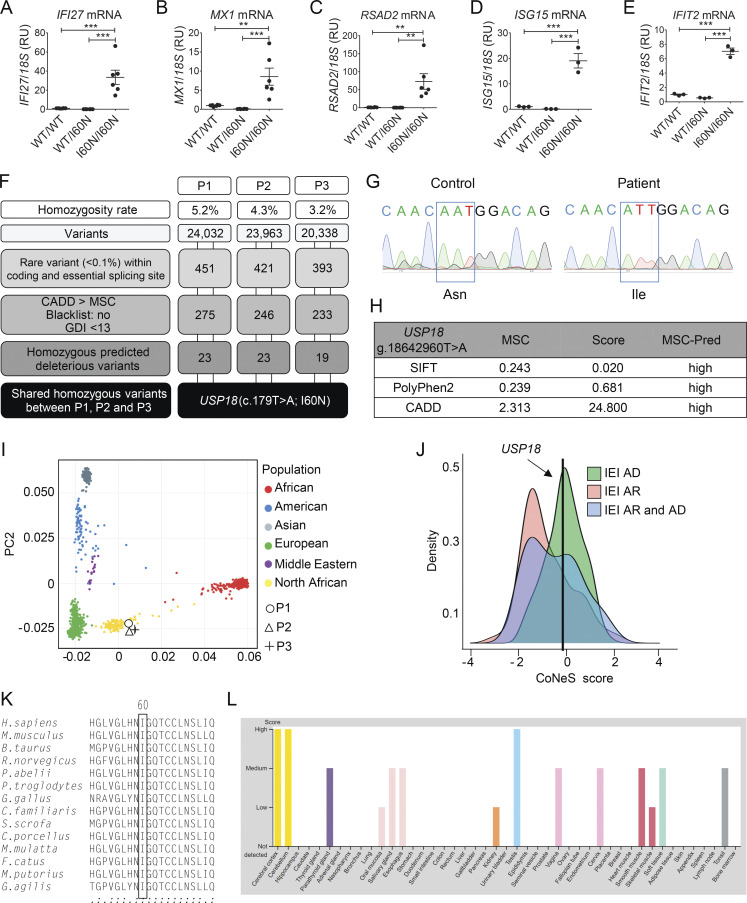
Figure S1.
Characterization of the USP18 I60N allele. (A–E) Relative mRNA levels for IFI27, IFIT2, RSAD2, ISG15, and MX1 in peripheral blood from a healthy control (WT/WT), heterozygous mother (WT/I60N), or P1 (I60N/I60N) as assessed by quantitative RT-PCR. Bars represent the mean of two independent experiments; data analysis was performed with unpaired t tests. **, P < 0.001; ***, P < 0.0001. (F) Schematic demonstrating variant analysis pipeline and results from WES. GDI, gene damage index. (G) Electropherograms showing the WT USP18 sequence of control or homozygote c.179T>A, p.I60N mutation in P2 cDNA extracted from EBV-B cells. (H) Predictive (Pred) effects of I60N mutation determined by using PolyPhen-2, Sorting Intolerant from Tolerant (SIFT), and CADD scores. (I) Principal component analysis showing the origins of P1, P2, and P3 plotted on main ethnic origins extracted from the 1,000 Genomes database and our own WES database. (J) CoNeS (consensus negative selection) for USP18 and its distribution for genes causing inborn errors of immunity (IEI), according to disease mode of inheritance. AD, autosomal dominant. (K) Multiple sequence alignment of human USP18 and its orthologues. The Ile60 residue of human USP18 (top row) and the corresponding residues in the other species are boxed. (L) Levels of expression of USP18 in different tissues according to the Human Atlas website (https://www.proteinatlas.org/ENSG00000184979-USP18/tissue). RU, relative units.

