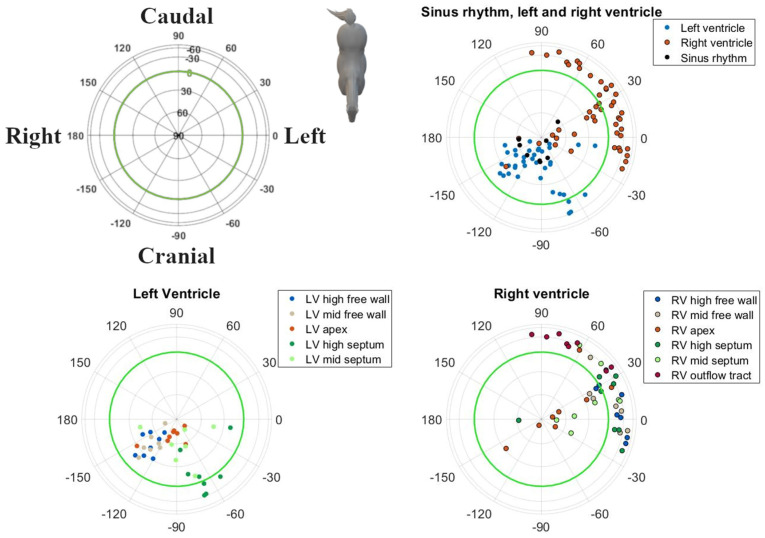
Figure 4.
Spatial directions of the maximum electrical axis (MEA) of the QRS complex for individual induced VPDs and SR, visualized with a Lambert azimuthal equal-area plot. The spatial direction of the MEA was calculated over the entire QRS complex. Dots inside the green circle represent a dorsal MEA, while outside dots represent a ventral MEA. Left is 0°, caudal is 90° azimuth and dorsal is 90° elevation.

