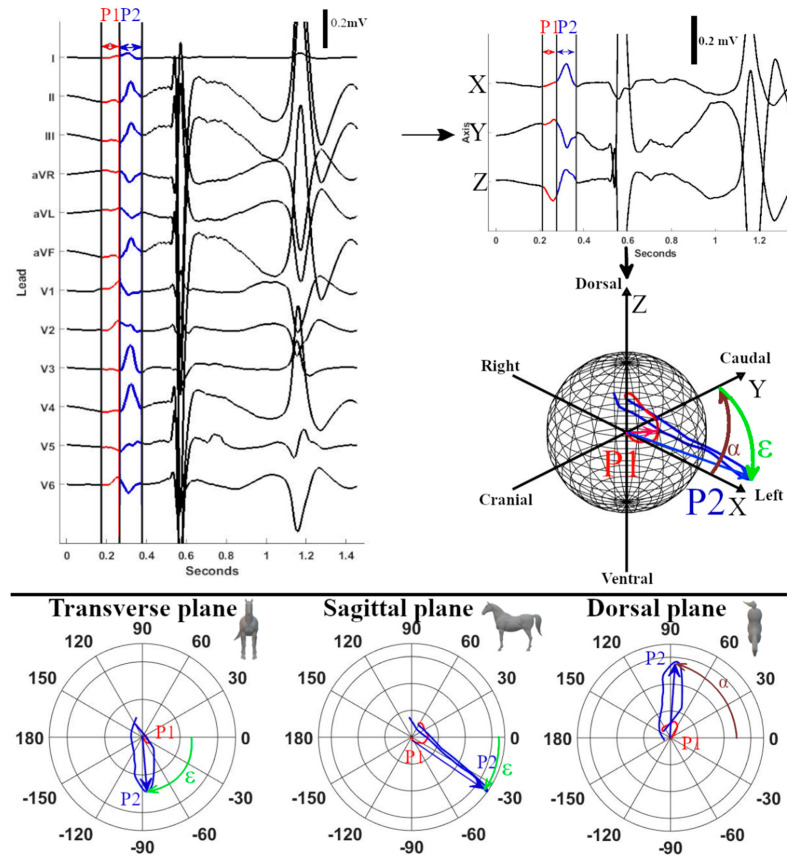
Figure 2.
Example measurements of P wave characteristics of a median sinus rhythm or paced beat. The first (P1) and second (P2) part of the P (sinus rhythm) or P’ (paced complex) wave were selected on the 12-lead ECG. After selecting the timeframe, the VCG axes were calculated from the 12-lead ECG with X representing the right–left, Y the cranial–caudal, and Z the ventral–dorsal axes. After the calculation of the VCG, the spherical coordinates were calculated from the VCG; for P1 and P2, the coordinate with the largest radius is the mean electrical axis (MEA). The MEA is shown by the red (P1) or blue (P2) arrow on the sphere. The azimuth (α) and elevation (ε) of MEA2 are indicated on the sphere. Below the sphere, 3 polar plots are given with the transverse, sagittal, and dorsal projections of the VCG. The MEA of P2 is indicated on the polar plots by the blue arrow with the measurements for the azimuth and elevation. Note on the 2D polar plots that the elevation measured from the transverse plane has a different angle than the measurement from the sagittal plane. This is because the maximum radius of the VCG is view-dependent if projected into a 2D plane. It is also why the azimuth, elevation, and maximal radii for the statistics were measured in 3D space.

