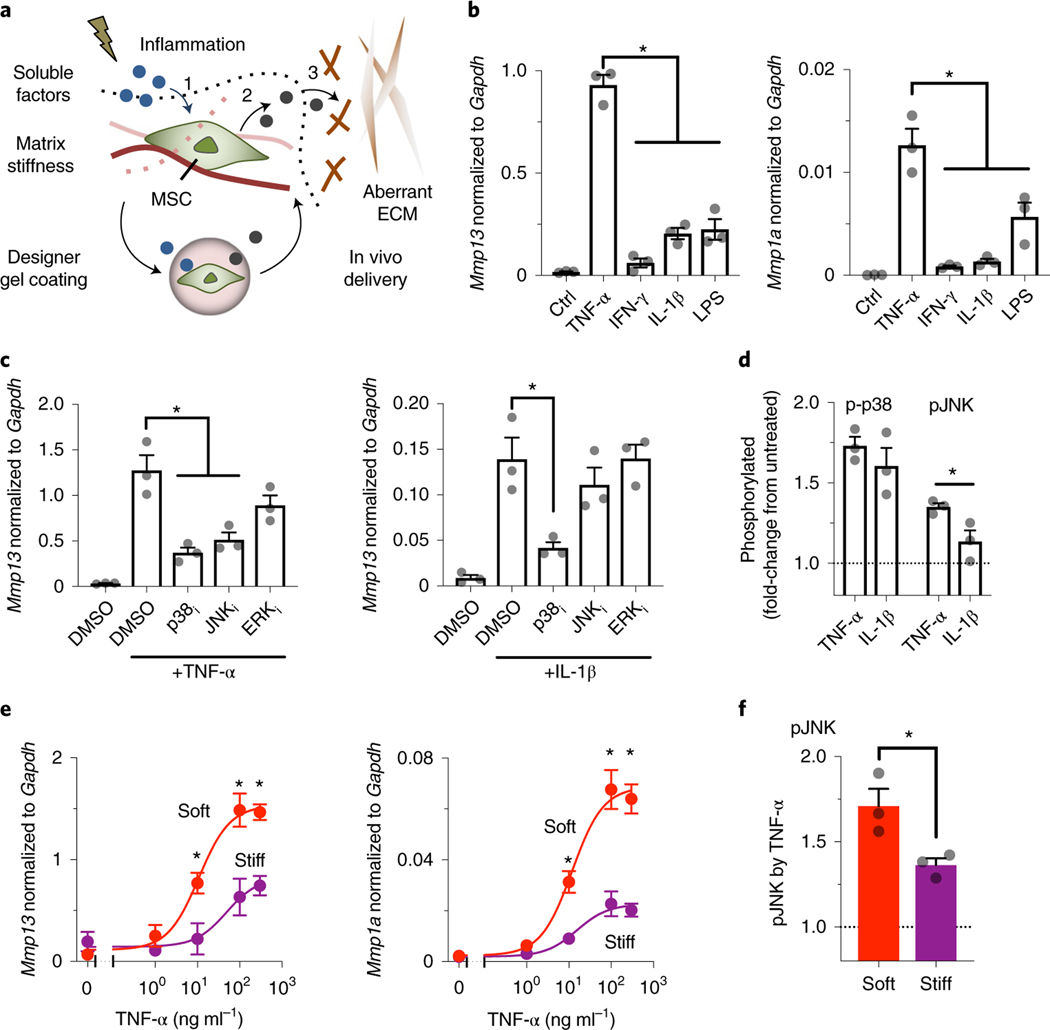
Fig. 1 |. Defining chemomechanical cues that enhance the production of soluble interstitial collagenases in mouse MSCs.
a, Tissue injury induces changes in both inflammatory and biophysical cues that influence the ability of MSCs to (1) accept soluble signals and (2) interpret them to produce paracrine factors. Gel coating can provide MSCs with predefined chemomechanical cues to optimize specific mechanisms of action, such as (3) correction of aberrant ECM remodelling. b, Left: effects of soluble inflammatory mediators on expression of Mmp13; and right: of Mmp1a, in D1 mouse MSCs treated for 3 days on plastic culture. TNF-α, IFN-γ and IL-1β were added at 100 ng ml−1, while LPS was added at 2,000 ng ml−1.Transcript levels are normalized to Gapdh. *P = (1.4–2.9)×10−5 (left), P = (0.2–2.4) × 10−2 (right). Ctrl, control. c, Left: effects of inhibitors against signalling pathways on Mmp13 expression induced by TNF-α; and right: by IL-1β, in D1 mouse MSCs treated for 3 days on plastic culture. p38i, p38 MAPK inhibitor, SB203580 (10 μM); JNKi, JNK inhibitor, SP600125 (20μM); ERKi, ERK1/2 inhibitor, U0126 (5μM); *P = (0.6–2.3) × 10−3 (left), P = 8.8 × 10⁻³ (right). For b and c, individual P values were derived from one-way ANOVA followed by Tukey’s multiple comparisons test. d, Phosphorylation levels of p38 MAPK (p-p38) and JNK (pJNK) after stimulation of D1 mouse MSCs in suspension with TNF-α or IL-1β for 20 min. *P = 3.7 × 10⁻² via paired t-test. e, Dose–response curves of TNF-α to upregulate mRNA expression of collagenases in D1 mouse MSCs in soft or stiff bulk alginate-RGD hydrogels after 3-day treatment. Left: Mmp13: IC50 and maximum transcript levels for soft, 10.8 μM and 1.53, respectively; for stiff, 48.83 μM and 0.82, respectively. Right: Mmp1a: IC50 and maximum transcript levels for soft, 11.9 μM and 0.069, respectively; for stiff, 15.42 μM and 0.023, respectively. *P = (0.3–4.9) × 10−2 (left), P = (0.9–4.8) × 10−2 (right) via two-way ANOVA followed by Bonferroni’s multiple comparisons test. f, Phosphorylation levels of JNK after stimulation of D1 mouse MSCs in soft or stiff alginate-RGD gels with TNF-α for 20!min. *P = 3.4×10⁻² via paired t-test. The dotted lines in d and f indicate the normalized level of phosphorylated proteins without treatment with cytokines. For b–f, n = 3 independent experiments, each performed in three replicates; grey circles represent data points. All data are shown as mean ± s.e.m.

