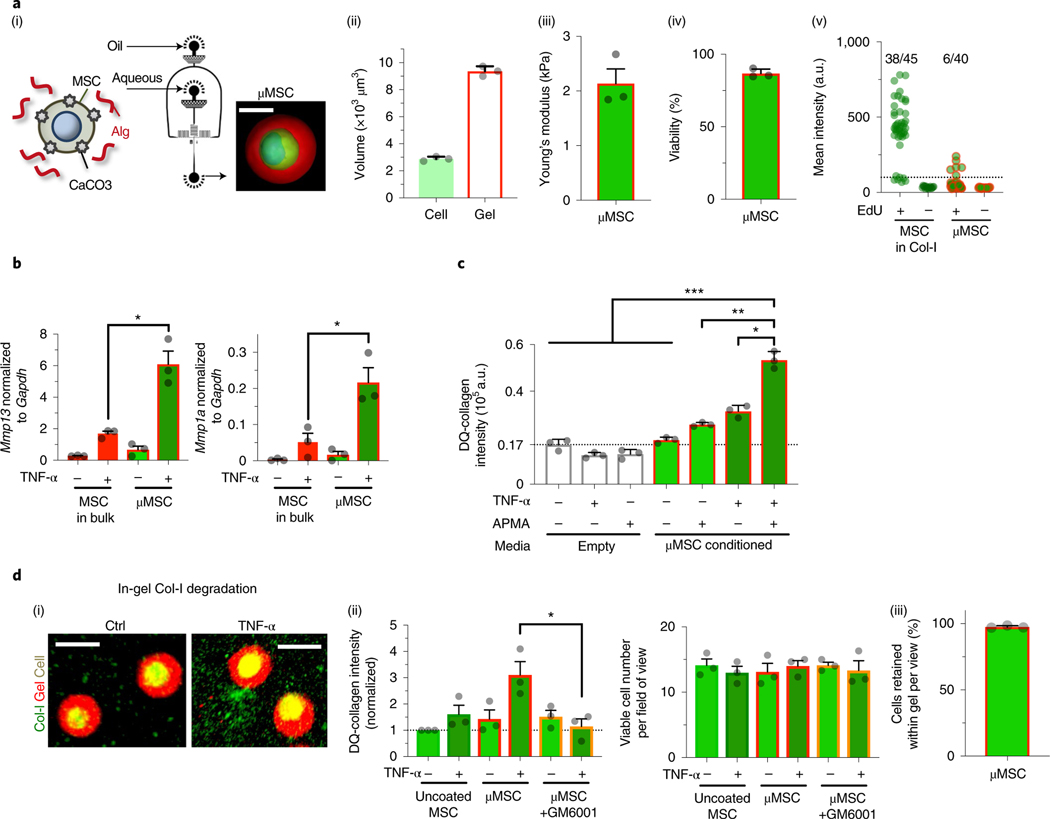
Fig. 2 |. Packaging chemomechanical cues into engineered gel coating for single mouse MSCs to enable paracrine matrix remodelling.
a, Characterization of gel-coated D1 mouse MSCs. (i) Schematic showing the droplet microfluidic approach to coat single MSCs in a thin layer of alginate (Alg) gels (μMSC) (Methods). Inset: representative confocal image of a gel-coated MSC after reconstruction (green, cytoplasm; blue, nucleus; red, alginate-rhodamine; scale bar, 10μm). (ii) Volume of cells (calcein) and gel coating (alginate-RGD with rhodamine) from confocal microscopy 6 h after encapsulation. n = 3 independent experiments, each averaged from seven gel-coated cells. (iii) Elasticity (Young’s modulus, E) of the gel coating. n = 3 independent experiments, each averaged from five gel-coated cells. (iv) Percentage of viable gel-coated D1 mouse MSCs after 3 days in culture. n = 3 independent experiments, each performed in two replicates. (v) Incorporation of EdU by D1 mouse MSCs in collagen-I (Col-I) gel or gel-coated MSCs over 1 day in culture. The dotted line indicates a background signal measured in the absence of EdU. The values indicate the fractions of cells that incorporated EdU above the background level from the data pooled from 3 independent experiments. CaCO3, calcium carbonate nanoparticles; a.u., arbitrary units. b, Left: effects of TNF-α (100 ng ml−1) on expression of Mmp13; and right: of Mmp1a, in D1 mouse MSCs in soft bulk gel or gel coating after 3-day treatment in culture. *P = 4.5 × 10⁻⁴ (left), P = 5.9 × 10⁻³ (right). c, Collagenase activity in the conditioned media. The media were collected from gel-coated MSCs (50,000 cells per 200 μl) ± TNF-α (100 ng ml−1) for 3 days, followed by mixing with fluorogenic Col-I substrate (DQ-collagen, 100 μg ml−1) ± latent MMP activator APMA (1 mM) and incubating for 1 day before readout. The dotted line indicates a background signal from a complete DMEM. *P = 1.2 × 10⁻⁷; **P = 6.0 × 10⁻⁹; ***P = (0.4–3.7) × 10−10. For c and d, n = 3 independent experiments, each performed in three replicates. d, Collagen degradation by embedded uncoated or gel-coated D1 mouse MSCs for 1 day in the presence of APMA. (i) Representative images. Scale bar, 20 μm. (ii) Quantification. Left: degraded DQ-collagen (green+) volume per field of view. GM6001 (10 μM): pan-MMP inhibitor. Each group was normalized to the uncoated MSC without TNF-α group.; *P = 2.0 × 10⁻². Right: viable (calcein+) cell number per field of view. n = 3 independent experiments, each averaged from three fields of view. (iii) Percentage of cells retained within gel coating after culturing for 3 days. n = 3 independent experiments, each averaged from five fields of view. Individual P values were derived from one-way ANOVA followed by Tukey’s multiple comparisons test. Grey circles throughout represent data points. All data are shown as mean ± s.e.m.

