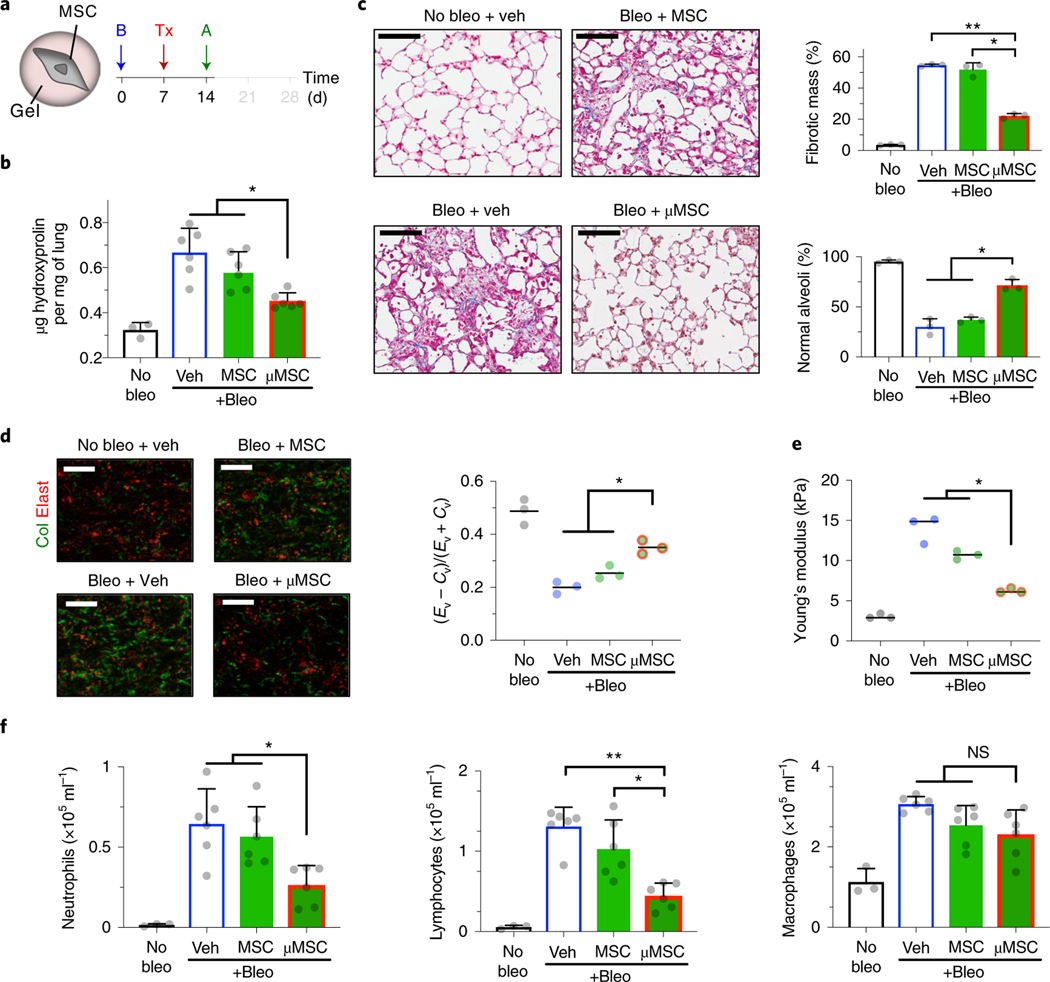
Fig. 3 |. Mouse MSCs in gel coating promote normal tissue remodelling after fibrotic lung injury.
a, Experimental design. B, bleomycin (bleo); Tx, treatment—vehicle (veh), uncoated D1 mouse MSCs or gel-coated MSCs (μMSCs); A, analysis. b, Hydroxyproline levels in lung tissue. n = 3 animals for no bleo and n = 6 for other groups. *P = (1.8–4.1) × 10−2. c, Histological evaluation of collagen deposition. Left: representative images from Masson’s trichrome stain. Scale bar, 100μm. Top right: percent total fibrotic mass at low magnification. n = 3 animals per group, each data point averaged from three fields of view from three tissue sections of each animal. Bottom right: percent normal alveoli at high magnification. n = 3 animals per group, each data point averaged from nine fields of view from three tissue sections of each animal. *P = 2.3 × 10⁻² (top right), P = (8.2–9.9) × 10−3 (bottom right); **P = 2.1 × 10⁻⁴ (top right). d, Parenchymal collagen and elastin levels. Left: representative images from two-photon microscopy. Scale bar, 20 μm. Right: elastin (Ev)-to-collagen (Cv) volume ratio index (Ev − Cv)/(Ev + Cv). n = 3 animals per group, each data point averaged from three fields of view from a lung of each animal. *P = (0.7–4.2) × 10−2. e, Microelasticity of lung tissue sections measured by atomic force microscopy. n = 3 animals per group, each data point averaged from 15 indentations of random regions from three tissue sections of each animal for no bleo, 30 indentations for other groups. *P = (0.4–4.8) × 10−2. f, Left: quantification of neutrophils; middle: lymphocytes; and right: macrophages, in bronchoalveolar lavage fluid. n = same as b. *P = (3.0–4.8) × 10−2 (left), P = 4.4 × 10⁻² (middle); **P = 2.5 × 10⁻⁴ (middle); NS, not significant; P > 0.05 (right). Individual P values were derived from one-way Welch ANOVA followed by Dunnett T3 multiple comparisons test. All data are shown as mean ± s.d.

