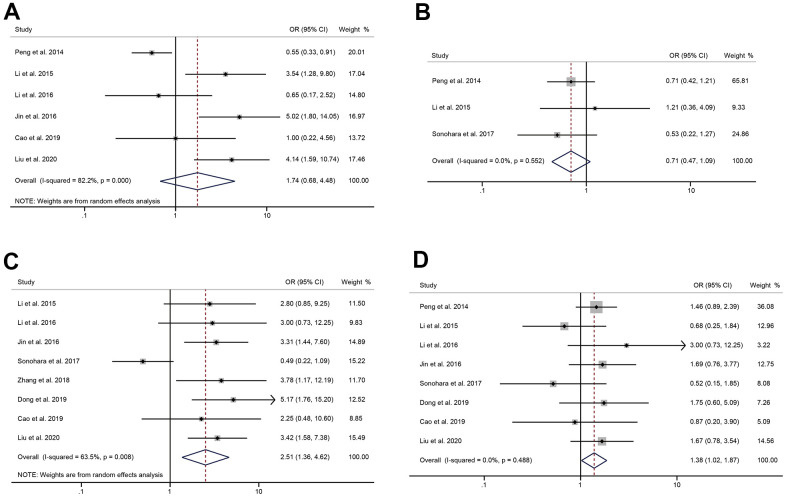
Figure 4.
The correlation between HULC expression level and tumor characteristics. (A) The forest plot of ORs for the correlation between HULC expression and tumor size in patients with digestive system tumors; (B) The forest plot of ORs for the correlation between HULC expression and number of tumors in patients with digestive system tumors; (C) The forest plot of ORs for the correlation between HULC expression and TNM stage in patients with digestive system tumors; (D) The forest plot of ORs for the correlation between HULC expression and differentiation in patients with digestive system tumors.

