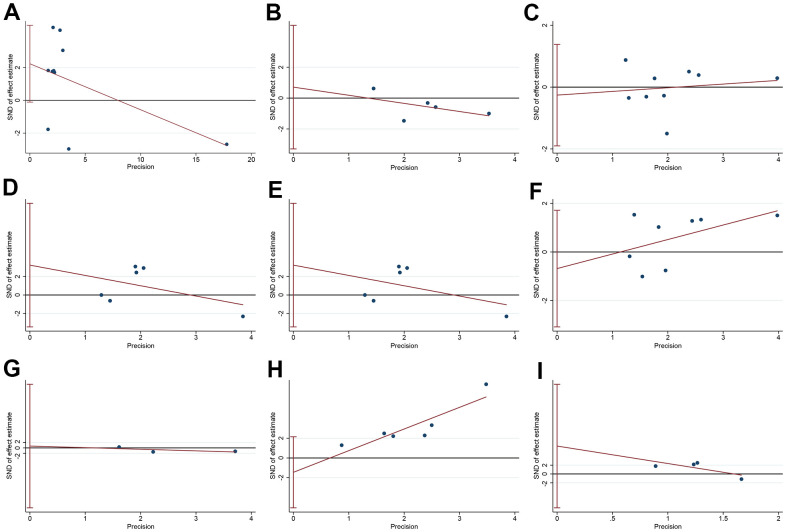
Figure 7.
The publication bias of HULC-related research. (A) The Egger’s test and linear regression plot for the publication bias of OS; (B) The Egger’s test and linear regression plot for the publication bias of age; (C) The Egger’s test and linear regression plot for the publication bias of gender; (D) The Egger’s test and linear regression plot for the publication bias of tumor size; (E) The Egger’s test and linear regression plot for the publication bias of TNM stage; (F) The Egger’s test and linear regression plot for the publication bias of differentiation; (G) The Egger’s test and linear regression plot for the publication bias of number of tumors; (H) The Egger’s test and linear regression plot for the publication bias of lymphatic node metastasis; (I) The Egger’s test and linear regression plot for the publication bias of distant metastasis.

