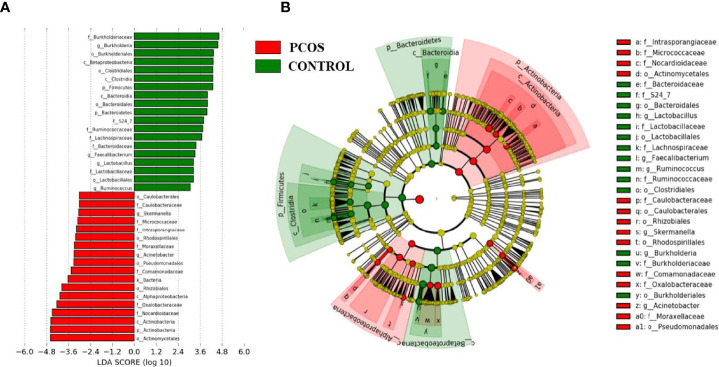
Figure 3.
Linear discriminant analysis effect size (LEfSe) analysis of the two groups. (A) Linear discriminant analysis (LDA) represented statistical and biological differences between the two groups (LDA > 3.0, p < 0.05). (B) Cladogram demonstrated microbiome differences of the two groups at various phylogenic levels.

