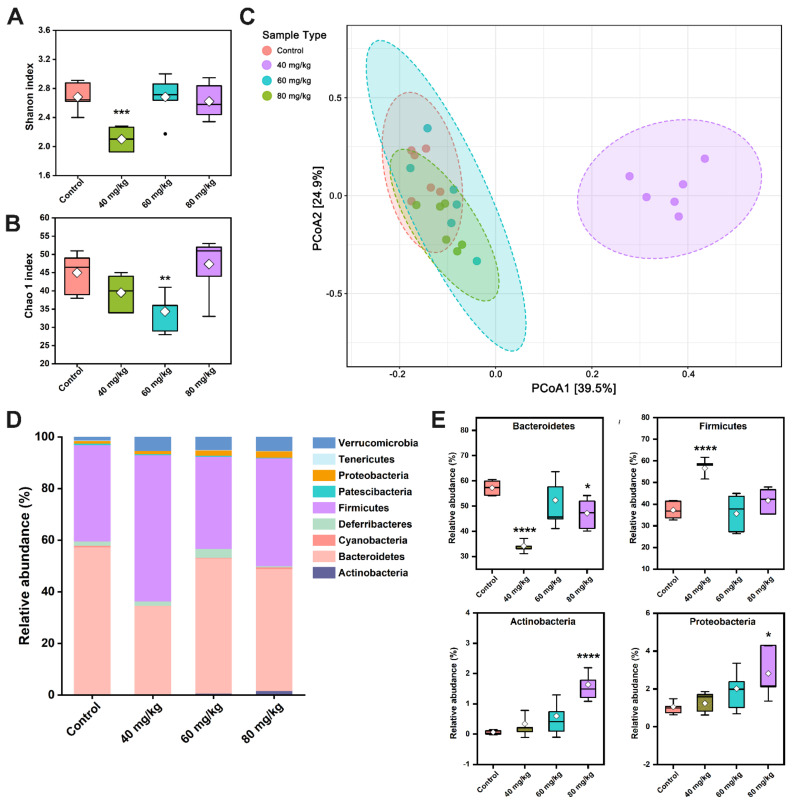
Figure 7.
Effect of CAP on the overall structure of gut microbiota. The (A) Shannon index, (B) Chao1 index, and (C) PCoA, with extended functionality for the labeling groups and with normal probability ellipsoids for different groups. (D) Distribution of bacterial taxa at the phylum level. (E) Comparison of the main phyla in the different groups: Bacteroidetes, Firmicutes, Actinobacteria, and Proteobacteria. * p < 0.05, ** p < 0.01, *** p < 0.001, and **** p < 0.0001 vs. control.

