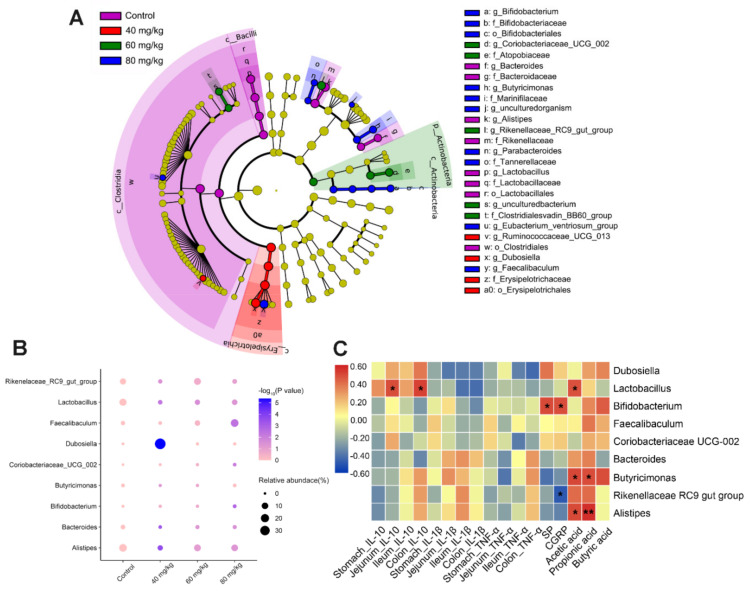
Figure 8.
Changes in gut microbiota after CAP treatment. (A) LEfSe analysis of gut microbiota is shown as a cladogram among all groups (LDA scores > 3.0). (B) Relative abundance of differential microorganisms at the genus level. p-values represent the discrepancy compared with the control group. Values are reported after one-way ANOVA followed by the LSD multiple-comparison test. (C) Heatmap of Spearman’s correlation between the relative abundance of gut microbiota at the genus level and the relevant indicators. * p < 0.05, and ** p < 0.01 vs. control.

