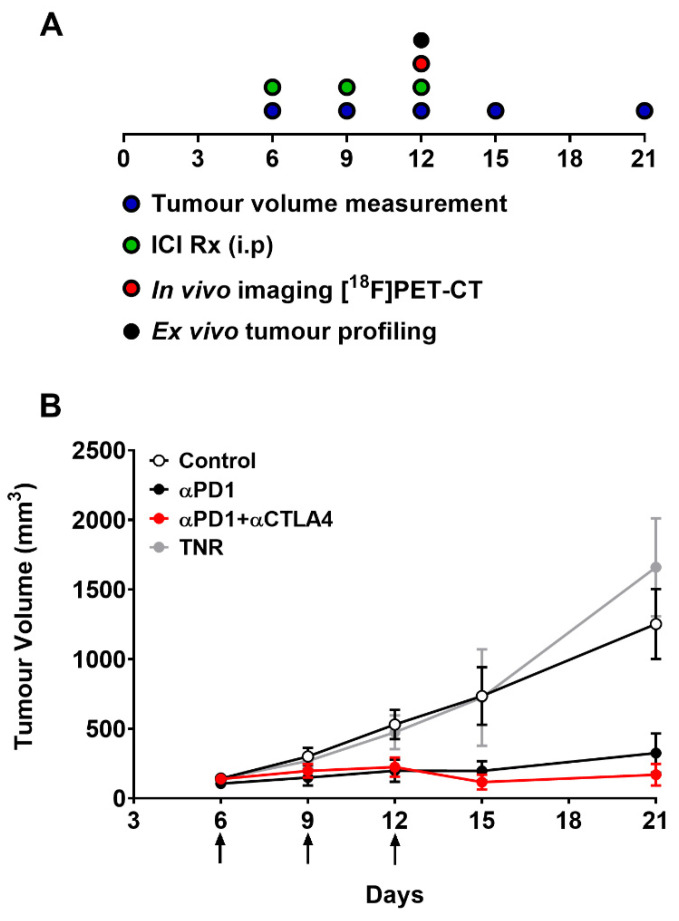
Figure 2.
(A) Schematic representation of timeline showing dosing, measurement and imaging regimen. Mice (n = 10–15) were i.p. treated with control IgG, αPD1 monotherapy or combined αPD1 + αCTLA4 on days 6, 9, and 12 post tumour implantation. (B) Average tumour volume of CT26 tumour-bearing mice on days 6, 9, 12, 15, 19 and 21 post tumour implantation. Data are represented as the mean ± S.D. Data are shown post therapy response separation and represented as the mean ± S.D. (TNR, treated non-responder).

