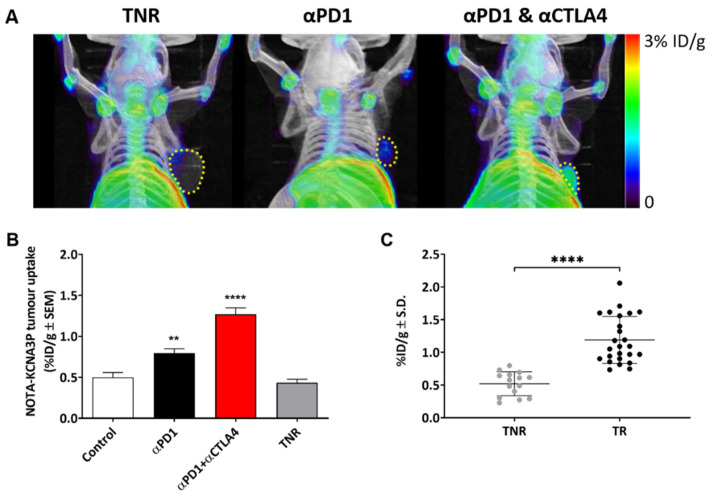
Figure 3.
(A) Representative maximum intensity projection PET-CT images showing [18F]AlF-NOTA-KCNA3P tumour retention in αPD-1 responders, combined αPD1 + αCTLA4 responders and TNRs. Yellow dashed line indicates tumour boundary. (B) [18F]AlF-NOTA-KCNA3P tumour uptake values in each treatment arm; Control, αPD-1 responders and combined αPD1 + αCTLA4 responders compared to treated non-responsive tumours (TNR, n = 10–12 mice/ group; ** p < 0.01, **** p < 0.0001 comparing to TNR; data shown as the mean %ID/g ± S.E.M.). (C) [18F]AlF-NOTA-KCNA3P tumour uptake in CT26 TRs and TNRs (**** p < 0.0001, data shown as individual %ID/g).

