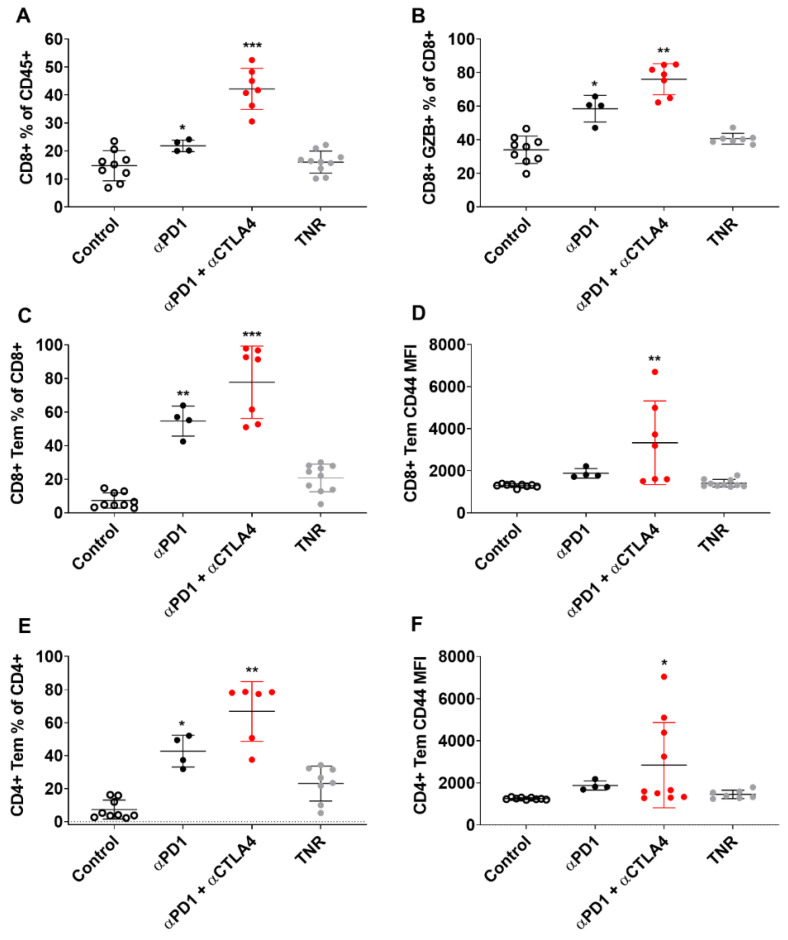
Figure 4.
Multicolour Flow cytometry analysis of CT tumour associated immune cells after treatment. Percentages of (A) CD8+ T cells relative to CD3+ cells, (B) GZB+ CD8+ TILS relative to total CD8+ TILS, (C) CD8+ TEM cells relative to total CD8+ cells (D) CD8+ TEM cells relative to total CD8+ cells MFI (E) CD4+ TEM cells relative to total CD4+ cells (F) CD4+ TEM cells relative to total CD4+ cells MFI across all treatment arms. Data are shown as individual values with the mean ± S.D. and are representative of n = 5–10 mice/ group. * p < 0.05; ** p < 0.01; *** p < 0.001 compared to TNR.

